Posit Conf 2024
Interesting talks from one of this year's biggest data science conferences
For the second time in two years, I attended Posit Conf last week. Staying on top of the ever-changing landscape and array of technologies in data science is a constant challenge. However, I've found that conferences like Posit Conf offer the best way to "see the forest for the trees." These events provide direct insights from developers about their libraries' new capabilities. Additionally, you hear from industry professionals about how they're applying these innovations in practice.
What's even better about Posit Conf in recent years is their embrace of Python. Historically, Posit has been known for RStudio and other tools designed to work closely with programming language R. While R is an interesting and valuable language, as one of the conference talks emphasized, it's "R And Python" not "R Or Python." It's hard to ignore Python's value and importance in machine learning today, so it's refreshing to see it showcased as an equal at Posit Conf with just about as many Python focused talks as there were R.
Introducing Positron, a new data science IDE - Posit Team
Ask any good data science what tools they use, and you’re likely to get some passionate responses. That’s why I was particularly interested in the talks introducing Positron.
Positron is a brand new integrated development environment (IDE) and the first of its kind made “specifically for data science”. It’s packed with some interesting features aimed at making a data scientists life easier, like panes to summarize your variables in memory, viewing data frames, accessing databases, storing plots, all while being completely bi-lingual in supporting Python and R (with future language support coming as well).
Those that do anything in Visual Studio Code will instantly recognize Positron as the IDE was forked from the same underlying engine as VS Code. Where it differs, however, is that it’s customized for the tasks mentioned above, without requiring extensions for the built-in behavior (although additional extensions are still supported)
Positron is still in early development, but by all accounts it’s already very usable and fairly stable. If you’d like to install and try it yourself, you can do so from Posit’s Github page.
A future of data science - Allen Downey
I’m a big fan of Allen Downey’s work and have even done a whole post related to his idea of sports and log normal performances.
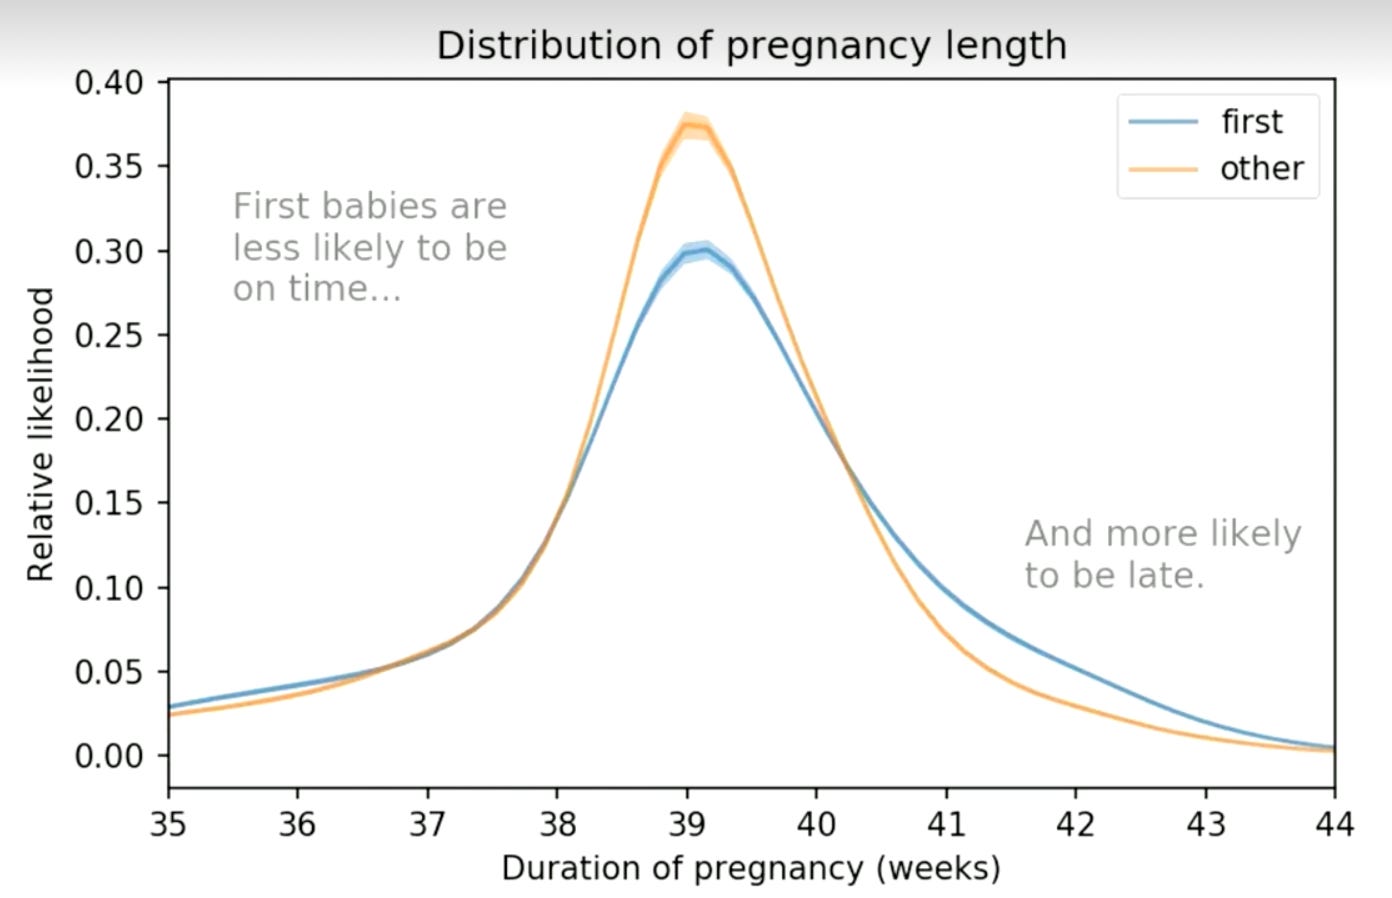
I was excited to see Allen as one of the keynote speakers and his presentation didn’t disappoint. He touched on just above everything from using computational statistics to show that first babies tend to be later than others, to where data science is on the inflated expectations curve, to finally concluding with a positive message about how nearly everything in society generally improves over time despite what we may think.
Keras 3: Deep Learning made easy - Tomasz Kalinowski
Anyone that has dipped their toes into deep learning has undoubtedly stumbled across Keras. It’s the more user-friendly brother of Tensor Flow that allows you to easily build deep learning models. Despite being simpler to use, it still allows for rather complex models to be built ranging from simple multi-layer perceptrons, to convolutional neural networks, to LSTM networks.
While Keras is historically a more Python centric language, there have been efforts made to port it over to R. This talk focused on introducing the ground-up rewrite of Keras 2, which was the previous implementation of Keras in R. It was interesting to see how quickly and easily deep learning models can now be made in R too instead of only Python.
Quarto Updates - Posit Team
Quarto is the successor to RMarkdown files and is something that Posit has supported for several years now. Quarto files are incredibly flexible “documents” that allow for a mix of code, markdown supported text, advanced formatting, and even various HTML scripts.
Their capabilities don’t just stop at documents though. You can create entire presentations, wikis, and even websites. And now the latest capability introduced this year was dashboards like the one below. Quarto now supports the ability to create dashboards with all kinds of custom interactive elements like maps, plots, tables, etc. That interactivity can further be enhanced by Observable JS, leaflet, plotly, shiny, and more.
At Pontem, we’ve had some interesting collaborations with companies looking for better ways of delivering information as compared to static reports (in fact more on that exact topic is coming very soon). I would personally love to see industries embrace these kind of enhanced documents more.
Wrapping up
I’ve started to look forward to Posit Conf each year now because of the wide array of things that are discussed. The talks mentioned above were just the tip of the iceberg, and really, just the ones that I found particularly interesting (despite them all being good).
There’s a lot of capabilities that can be taken from the data science community and applied to specific industries. I’m looking forward to having the opportunity to present at Posit Conf on behalf of Pontem, hopefully in the not too distant future.


