
OPP: Other People's Paraffin
We're down with WAT and WDT (yeah, you know me!)...and how each relate to production


Everyone knows that paraffins are Naughty By Nature. In this case study, we focus on the question, how warm does a fluid need to get before deposited wax is melted? This temperature is referred to as the wax dissolution temperature (WDT). Our colleagues at KAT define WDT “as the temperature at which the last crystals of wax are observed to dissolve into the oil on heating.”
When does that occur…well, that’s not that simple. We can often get caught in the cross-hairs of an academic WAT/WDT (minute, last crystal) and a practical WAT/WDT (impactful for operational design). And, when other people are measuring and reporting “a number”, where does it come from and on what basis?

We’ll be covering some basics about wax dissolution to frame the discussion and then attempt to relate lab work to the field (which may just be interesting enough to have a sequel). Specifically:
How do we measure it?
What are sources of error?
What are best practices to apply laboratory measurements to field operations?
We may be subtly pushing April as Wax History Month: we posted a case study on wax deposition this time last year. My subtitle in that post asked what the minimum flowline temperature below the Wax Appearance Temperature (WAT) would cause a plug to form.

It makes sense to spend most time talking about paraffin risks from the perspective of WAT: fluids come out of the ground hot, are transported via flowline to undergo separation or storage, and along the way lose heat to the point where fluid temperatures may drop below WAT and paraffin precipitation and/or deposition risks become real. Mitigation strategies may focus on WAT as a critical metric to keep fluids above this temperature. But what about remediation, and efforts to remove deposited paraffin? We need to start with defining a metric for this.
It seems I gotta start the explainin’…
Measuring Techniques
We are used to seeing WAT (Wax Appearance Temperature) used as a metric, when the first crystal of wax is observed during a fluid’s cooling path. The opposite of when wax first precipitates (or “appears”) is when it dissolves (or disappears). We note this temperature the Wax Dissolution Temperature (WDT). How is WDT measured? Many of the techniques employed to measure WAT (hot to cold) are also applicable for WDT if run in the reverse (cold to hot). Techniques include differential scanning calorimetry (DSC), cross-polarized microscopy (CPM), and filtration techniques are the most commonly referenced analyses. Other techniques have also been used, such as viscosity measurements. However, due variability and reproducibility concerns, CPM and DSC are the most common techniques employed.
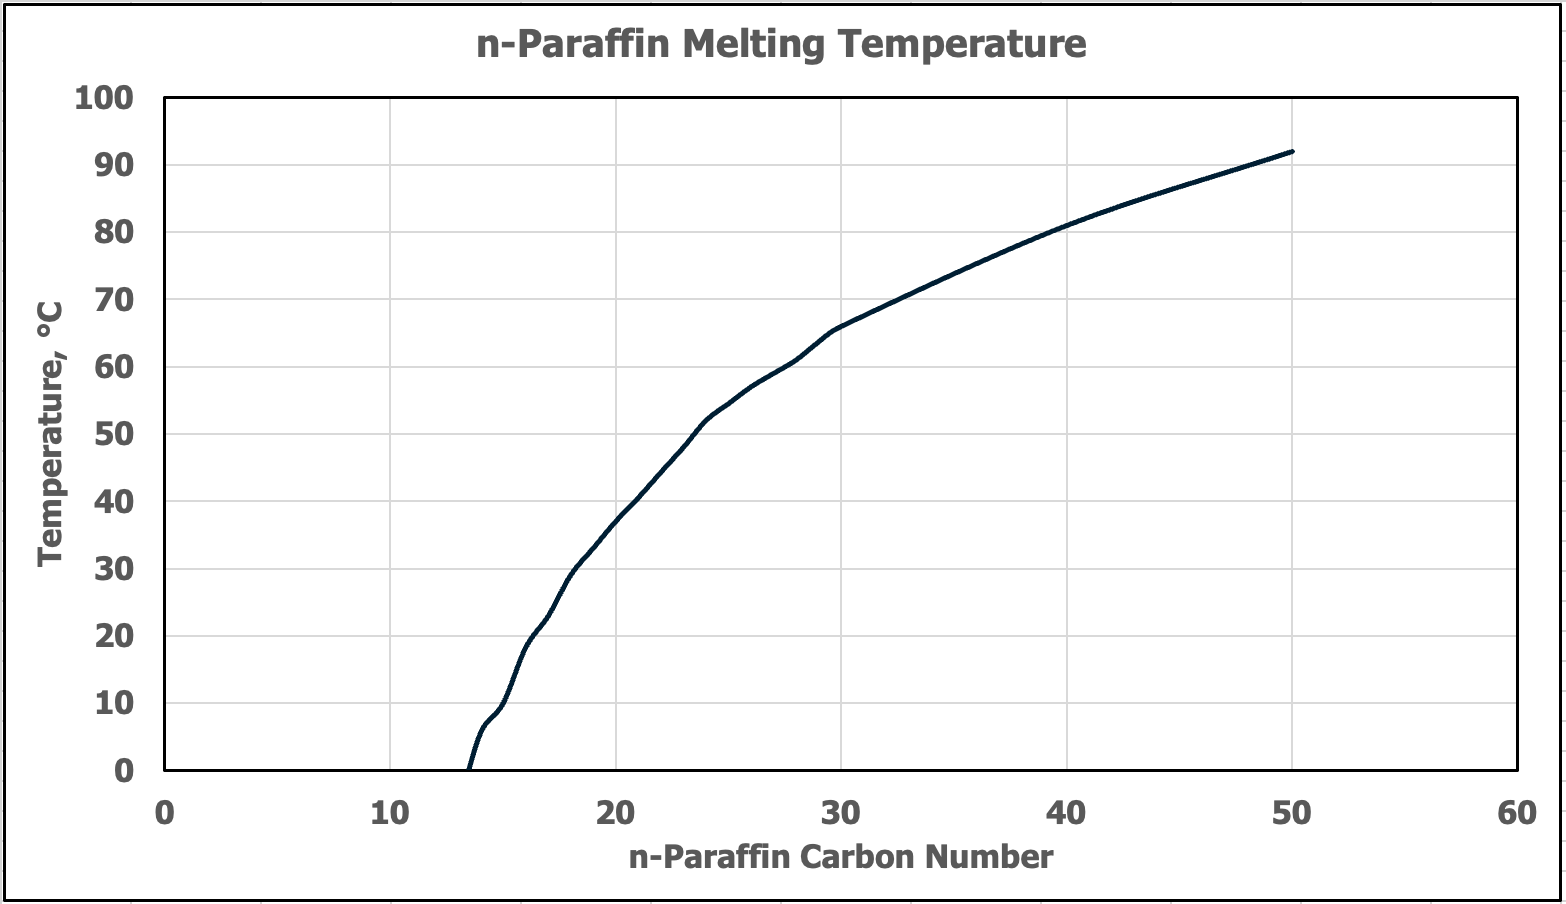
For reference, below are reported melting point temperatures for pure, n-paraffin compounds. The melting point of n-C25 (pentacosane) is 54.5°C, while n-C50 (pentacontane) is 92°C. This brings up an important and interesting point, which we’ll circle back to later in this post. The wax MELTING point (WMT) is not the same as the WDT. The temperature in which paraffin will dissolve back into crude oil is lower than the temperature in which paraffin will melt.
For example, the image below of GC traces comparing oil samples (white, yellow, and green) to standards (orange) show n-paraffins are present beyond n-C50. The WDT measurements are much less than +90°C (n-C50 melting point), despite the presence of paraffins > n-C50.

Differential Scanning Calorimetry (DSC)
Measuring wax formation and dissociation is based on detecting the exotherm exhibited in crystal formation from the liquid phase, and conversely, the endotherm detected in a solid crystal transitioning to the liquid phase. There is a balancing act in setting the rate of temperature change over time: the faster rates will have better signal to noise at the expense of overshooting the true melting point temperature. The slower rate of change is more accurate in pinpointing the melting/freezing point, however there is a lower sensitivity because there will be fewer molecules at each temperature point undergoing a phase change. While each oil is unique, 1°C - 2°C per minute tends to be the sweet spot.
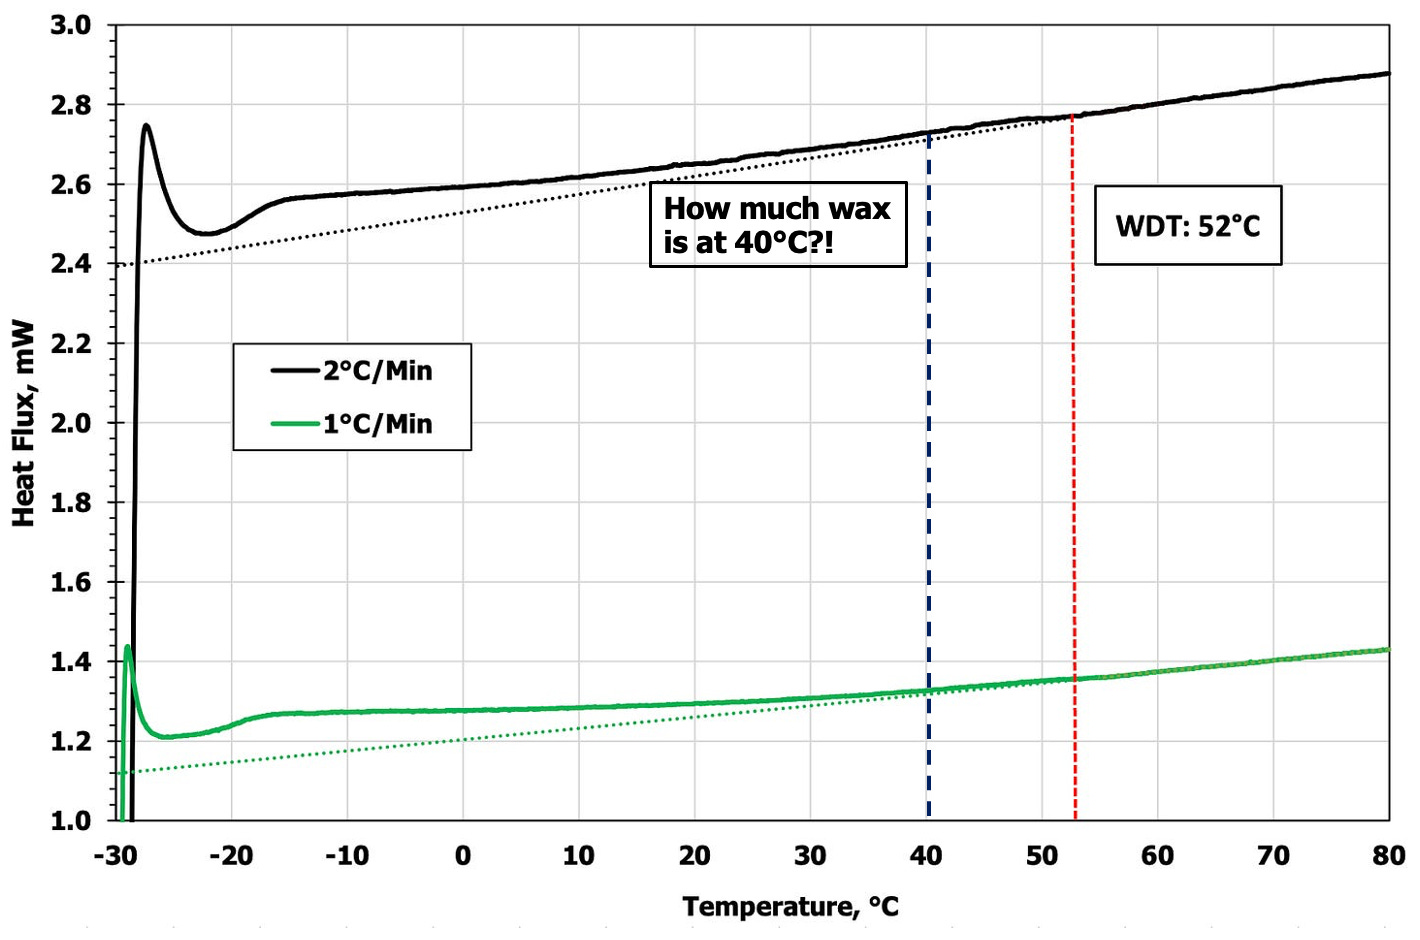
The phase change temperature (WDT if heating and WAT if cooling) is the point at which the heat flux curve deviates from the baseline at the high temperature end of the Heat Flux vs Temperature curve. As a sample is cooled, the Heat Flux will generally decrease (see blank example below). While not perfectly linear through the temperature sweep, between 70°C-100°C there is a linear slope, which is where we target to set the linear slope in measured samples. With the addition of a liquid hydrocarbon sample, the Heat Flux baseline increases in magnitude, however generally speaking, the sample will be single phase in the closed sample chamber as there is little to no head space for flashing. It is within this region a linear line is created as a baseline, which is extrapolated down to the lowest temperature of the test.

In the graph below, the baseline is noted as the dotted lines, and the WDT for this oil is measured at 52°C. We note a distinct and wide difference between the measured WDT and the measured WAT (2nd graph below), which is reported at 34°C. That’s a delta of 18°C (32°F)!
A second point worth exploring: the data at 40°C (12°C cooler than the WDT) shows virtually no wax remaining by noting how close to the baseline the heat flux is. Does this matter operationally? The heat difference is massive, but how much does that small amount of wax matter? This intrigued us enough to keep digging.

Given the WAT/WDT delta is a known phenomenon, the magnitude of this delta raises questions: 1)how repeatable is this (is it always 32°F?); and 2)how much does this matter? The gap is real, and academically speaking, there are a lot of interesting things to examine. But is there something tangible we can pull from these measurements that are applicable in an operations environment? To answer these questions, we collaborated with our friends at SPL to shine some light on the topic.
OPP, how can I explain it? I’ll take it frame by frame it…
Cross-Polarized Light Microscopy (CPM)
Assuming the first crystal to show up when cooling is the WAT and last crystal to melt indicates a fluid’s WDT when heating, is there another metric to provide practical guidelines? We turned to CPM to answer this, as CPM has excellent sensitivity and allows visual observation of wax crystals under the microscope.
In the schematic below, we can visualize wax appearing as the crude oil is cooled from 60°C to 0°C. Note more wax crystals propagate as the temperature decreases, which happens because the many wax species in a crude sample will have different cloud points and more wax continues to crystalize as the sample is cooled. In other words, not all wax crystalizes at the WAT.

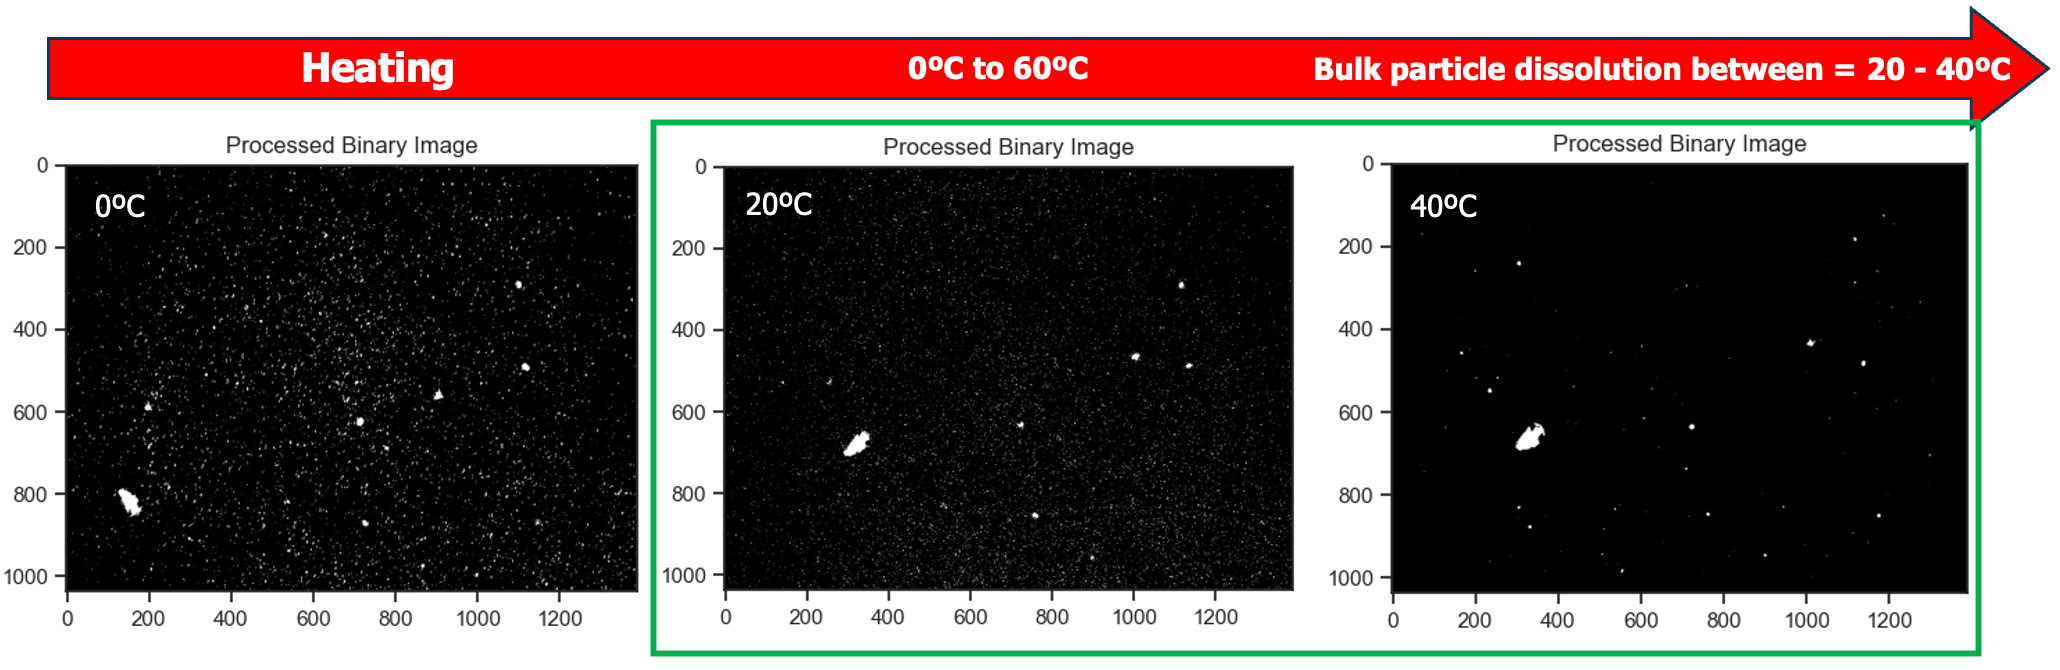
Next is the heating phase (red arrows), and we are presenting images collected in step-wise sequence to detect when all observed wax melts. There are a few important observations to note. Highlighted in green, the bulk of wax particles dissolve in this temperature range. The number of wax images continues to decrease until temperatures reach 55°C - 60°C, which is aligned with the DSC data previously presented. What do these difference sets of dissolution temperatures mean, particularly related to operational best practices? We needed to pull on this thread more to answer this important question.

Particle counting analyses within a defined subsection of the captured images shows some interesting comparisons between cooling down the sample and heating it up. The chart comparison below shows the particles identified during the cooling down process, followed by the heating up process. We have further labeled the region 0°C - 20°C as the Initial Range, which describes the temperatures at the early stages of heating and is noted by several counted particles. Within this region we also noted the largest growth in particle count during cooling. In practice, there was a time delay in which the sample was held at 0°C that accounts for further particles forming. There is a larger discussion that could be had around how much wax would truly crystalize if allowed to sit for infinity and what is the thermodynamic equilibrium point required to state all wax is considered to be in a stable state.
In comparison, the heating cycle shows systematic decrease in particle count throughout the warming, until the green Critical Zone area (40°C - 50°C). Here, there are still more particles observed during heating than cooling, yet visually the wax particles are no longer noted throughout the viewing window. Instead, they are remote, isolated and sporadic. We believe this is where bulk dissolution has occurred for this crude. The final wax crystal does not melt until beyond 55°C - 60°C.

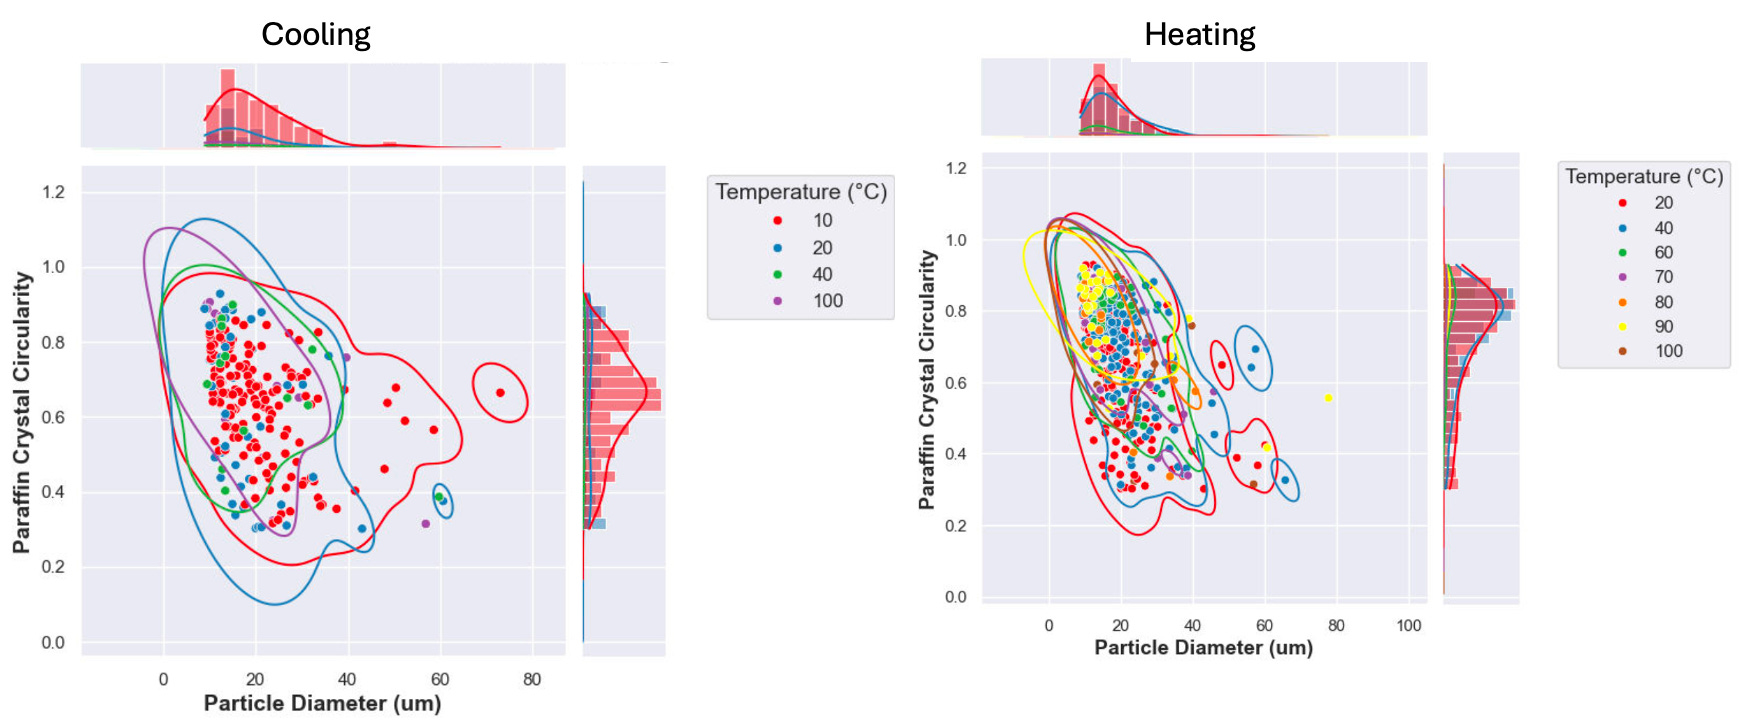
Close examination of the crystal morphology revealed some interesting insights, as well. Below are plots comparing particle crystal circularity to particle diameter at various temperatures. Crystal circularity values close to one tend to indicate higher purity (a uniform molecular structure will crystalize and grow uniformly), while lower circularity values indicate impurities or irregular crystal structures.
During the cooling cycle, smaller and more circular crystals appear at higher temperatures. This makes sense as there are fewer paraffin species that will crystalize at the higher temperatures, so they will be “more pure.” At very low temperatures, more paraffin is crystalized and the crystals grow larger and tend to lose circularity.
During the heating cycle, the more circular crystals are the last to dissociate, which is in line with the cooling cycle: these are the most organized crystal structures so they will be most circular, and will remain longest in a heat ramp. The less pure and largest crystals are shown to disappear at lower temperatures during the heat ramp. In other words, wax that shows up first (WAT) will not redissolve (WDT) until exposed to much higher temperatures.
The histograms along the axes make an important point: during cooling most of the crystals do not show up until near the endpoint temperatures are reached (<20°C). Upon heating, the vast majority of crystals have dissolved by the time 40°C is reached, suggesting a small wt% of paraffin influences the high WDT.
You may still be asking whether the WAT / WDT gap is reproducible? In a report from the University of Alaska Fairbanks, several crude samples from the Alaska North Slope were analyzed and part of the study included WAT and WDT measurements. As shown in the figure below, the delta between temperatures when wax first crystalizes and when wax completely melts ranged 3.8°C - 13°C (7°F - 24°F). We’ll come back to the North Slope in future posts, but this is an excellent example highlighting why a “rule of thumb” for estimating the delta is not always a good idea.

The University of Alaska Fairbanks report also cited similar phenomena with Kuwaiti and North Sea crudes, so it appears the difference between WAT and WDT is real, despite the fact that theoretically they should be the same value. Are there other possibilities besides crystal morphology that accounts for the differences in WAT and WDT? It could be a difference in achieving true thermodynamic equilibrium. Taken to infinity, the melting/freezing point of a molecule should be the same. However, when measuring WAT, the temperature is cooled at some dynamic rate. The recorded temperature while constantly cooling will be lower when the first crystal is observed in CPM, for example. Likewise, while heating up at a constant rate, the observed temperature in which the last crystal melts will be higher than the true equilibrium. This of course is dependent on the rate of temperature change, with larger differences occurring with faster temperature ramp rates. One work around is to heat/cool in slower stepwise increments. That is great for an academic number, however in the field changing temperature is quite dynamic.
Criticality of WDT
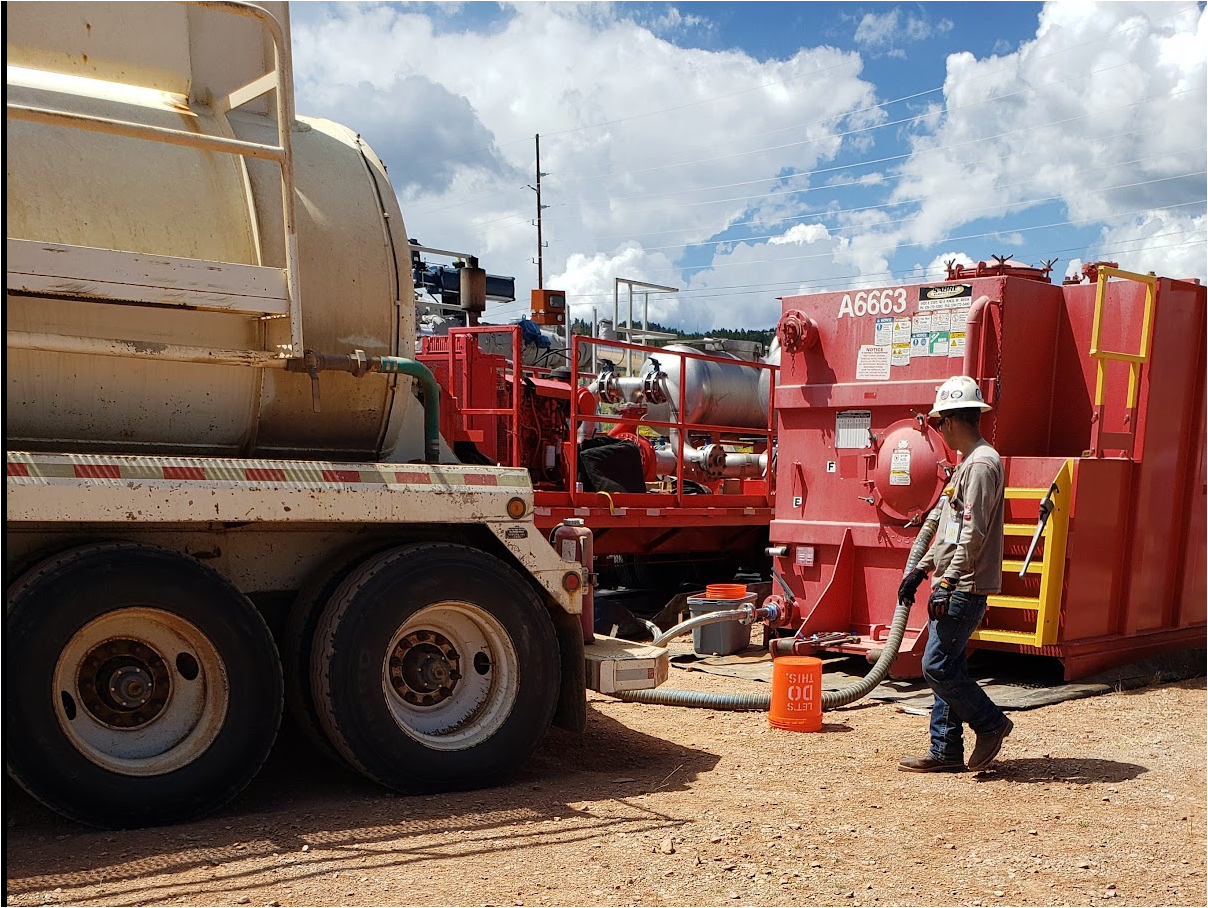
A number of operations can become cost-prohibitive or operationally difficult if we consider WDT as the threshold temperature required to remediate deposited wax. Hot oil circulation operations have a number of levers to pull to create the most effective remediation procedure. The temperature of the circulating oil and the duration of the operation will impact effectiveness, for example. A higher WDT will require hotter temperatures, longer contact time (i.e., more circulations), or both; and the longer the operation, the higher the cost if there are deferred production times incurred during a shut-in. We also must consider HSE considerations (PPE requirements, etc.) for extremely hot temperatures that may be need if we consider conservative upper-limits.
Now, when you do it, do it well and make sure that it counts; You’re now down with a discount…
Wax Melting Temperature
Oil tanks are susceptible to paraffin settling, especially when ambient temperatures drop below the WAT. Stokes Law can give us an estimation of time to settle, but we still inevitably have to consider clean-out operations if operating below WAT. It is far easier to maintain an elevated temperature on a tank than it is to remove paraffin deposits during a clean-out operation! Logistically, this makes sense. It is better to keep the temperature above the WAT than it is to heat above the higher WDT and melt a deposited wax on the tank wall.

Any process equipment (pipeline, tank, etc.) that is not maintained and/or have longer periods of time before remediation have a higher chance of having aged paraffin samples. What is aged paraffin?
When paraffin deposits, the paraffin will trap non-paraffin species and the deposit is typically soft and malleable. As paraffin ages, the crystal structures will become more well-defined as similar molecular structures align, which occurs because an organized crystal structure is more energetically favorable. The non-paraffin components are pushed out. What remains is a much harder, more brittle, and less malleable deposit. The impact can be seen in the earlier contour plot, where noted crystals were present at 90°C from an oil with a WAT of 32°C. Very likely, these were (nearly) pure paraffin components, which remained visible until melted!

In other words, the time component matters. Cool an oil down below its WAT and heat it up immediately and the WDT will be much different compared to waiting for a year to heat it up. The greater the time spent below the WAT, the more likely paraffin crystals will organize and become more structured. The brittle nature and high heat required both present problems for removing aged paraffin. Other challenges that negatively impact hot oil operations includes the contact time and the surface area of the deposit exposed to the heat. As both of these variables decrease, there can be a need to significantly increase the temperature in order achieve a successful operation and that may require a temperature significantly higher than the WAT.
This is why hot oiling a flowline that hasn’t been hot oiled in a long time isn’t as effective as one that is regularly remediated. The temperature isn’t hot enough and the contact time isn’t long enough. This brings us to our final example worth discussing: removing deposited wax from vessels, such as FPSO and FSO vessels.
FPSO’s store crude oil within their hull until it is able to be offloaded. An FPSO capacity can be quite large: 100,000 barrels to 2 million barrels. Depending on transportation times and exposure temperatures, a lot of paraffin can deposit and the removal process is a different challenge than the hot oil examples discussed previously. The paraffin removal is based on temperature requirements and the physical process of the Crude Oil Tank (COT) wash system, in which a pressurized spray jet is used to impact hot oil on the sides of the tanks. The contact time in soaks and circulation efforts is replaced with physically blasting wax off the wall. Setting the COT is a complicated process, which we will get into in a future post, however temperatures are often in excess of the WDT and approaching WMT.
Exciting, isn't it? A special kinda business, Many of you will catch the same sorta O.P.P. messing with
Concluding Thoughts
Managing paraffin risk and understanding the behavior of a crude oil within the production line should definitely include determining a crude oil WAT and WDT. These values are not intended to serve as “thou shalt...” or “shall not…” With specific reference to a crude WDT, it is important to include how measurements are made and include broader set of data, such as bulk fluid WDT ranges. Often, we receive lab reports with “a number”, we lose context on how that number was derived and/or how it should be properly applied to field applications.
Equally important are the production scenarios: are you heating a storage tank that is just going into service? It is likely a lower temperature, closer to the WAT, is required to maintain storage integrity. Are there known deposits in a tank that has been exposed to lower temperatures for a long time? Heating straps at the WAT are likely to be ineffective, and possibly may require temperatures above a measured WDT.
The point is the operation scenario and an expanded analysis of the crude oil characterization is often required to assess the risk AND develop a proper mitigation program, whether that is chemical or mechanical in nature or transient or steady-state in frequency.
Did you catch the Alaska tease?! We’re expanding our footprint and are excited to start talking about all the activity that is happening in the great 49th state! There are many technical challenges that are waiting to be solved and temperature is just one of many unique aspects to talk about related to Alaska production. Be sure to keep an eye out for more waxy posts and other interesting topics from Pontem.