Case Study: Wax Deposition in Flow Lines
What is the minimum flowline temperature below a WAT before a plug forms?
One Crystal of Wax…
Liquid hydrocarbons, crude oil specifically, is generically divided into four categories: saturates, aromatics, resins, and asphaltenes. A subset of saturates, paraffins, are not unlike other components of crude oil in that they are incredibly valuable and useful in multiple industries. In general, we like to produce them! And yet, they can present challenges under certain production scenarios as far upstream as downhole (although that’s really rare), through the wellhead, flowline, and topsides processing facility (Deepwater) or gathering center (Onshore). Producing a paraffinic crude oil it isn’t as simple as hot = good; cold = bad. All wax in a crude oil doesn’t simply crash out and deposit as soon as the temperature drops below the wax appearance temperature. There are lots of things to consider, such as thermal gradients, flow rates, and paraffin distribution. Before we get into those fun things, let’s orient ourselves with a little more background. After all, fluid properties are (hopefully!) fully characterized prior to ever producing a single barrel. What does it mean to have wax present in the liquid hydrocarbon phase and how does one know if there’s going to be a problem with it?!
An HTGC (High Temperature Gas Chromatography) scan will provide a simulated distillation analysis to report the n-paraffin distribution within a crude oil. An example is shown below, and is used to measure the weight percent paraffin within a crude.
The temperature at which paraffin first begins to destabilize and precipitate out of crude oil is referred to as the crude’s cloud point or WAT (wax appearance temperature). There are several techniques to rely on, each with a set of advantages and disadvantages. Some examples are shown in the figures below:

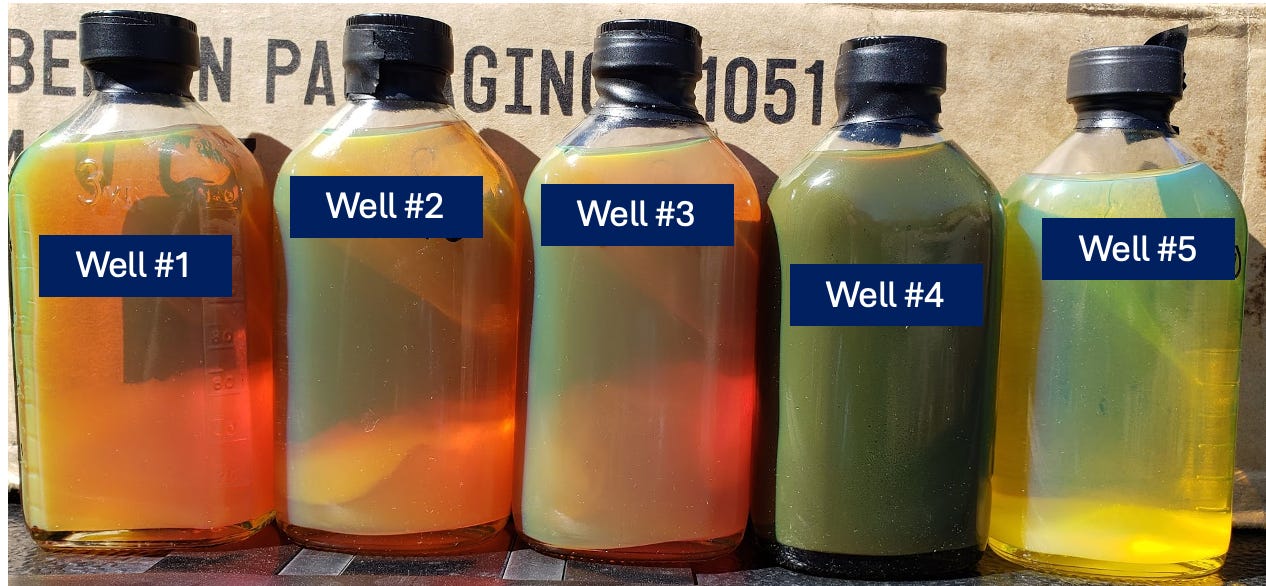
Cross-polarized microscopy involves slowly cooling an oil sample while visualizing the sample with polarized light. One advantage is the extreme sensitivity of the technique. One downside is the subjectivity of the interpretation: technicians have different opinions when the first crystal of wax appears. Also, the viewing area is a very small cross section of the sample, so there is risk of missing the first wax. Pontem has made strides in processing the visual data into a more standardized detection format. Stay tuned for a future post on ways we help our clients stay Disciplined to their Data.


As one might guess from looking at the DSC curve, increasing volume of wax will precipitate as the temperature is cooled. And interestingly, if there is not a thermal gradient between the bulk fluid of the liquid and the pipe wall (in other words when dT = 0) then there is no driving force for paraffin to deposit. When there is paraffin deposition in the flowline, it is typically manifested as an increase in dP on the line. An unexpected dP can be caused by a number of issues: hydrates, scale, wax, for example. Not to mention emulsion and flow related challenges. One is often sorting through production conditions looking for typical indicators to answer why, when, how. Almost like solving who Keyser Söze is.
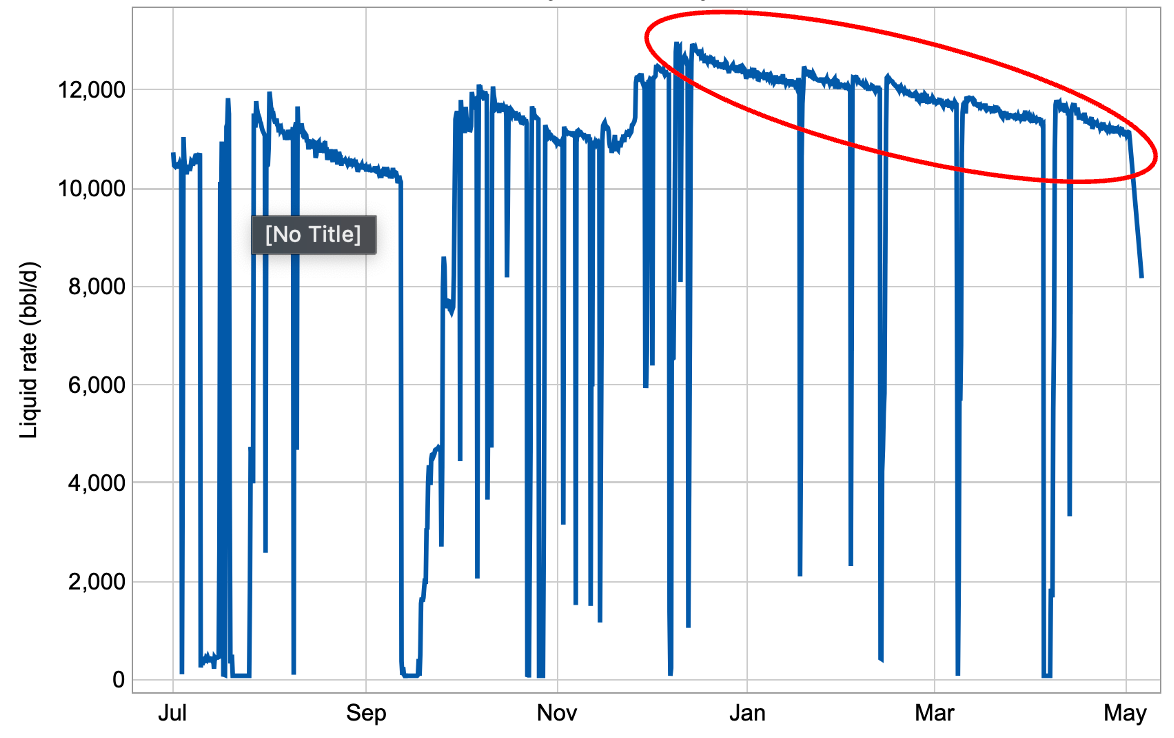
One such example came up in a project the Pontem team was brought in to investigate a rise in dP across a flowline from a subsea pump to the topsides processing facility and to help modify a mitigation program. The figure below shows the dP over the course of almost a year of production. From June to December, there were a number of transient events, including a new well coming on-line, planned and unplanned shut-ins. Following restart in December, the field was able to operate fairly consistently. From February to March, a 200 psi dP increase was observed, at which point operators knew they had a problem.
Our initial thought was to couple the dP events to liquid rates to see if there were any indications of a restriction or if there were normal increases in liquid rates one would expect with increased dP. In general, a potential restriction is possible if dP is trending upwards with a corresponding decrease in liquid flow rates. Conversely, a normal trend would show increasing flow rates with a corresponding increase in dP.
The liquid rate data is shown below and I’ve highlighted the critical data. Beginning in December, the flow rates are ~13,000 bbl/d and are trending downward as one would expect for a depleting reservoir. And from December thru February, the dP data is trending downward, too. This is normal behavior. However from February onwards. the dP is trending up with a downward trend in liquid production.
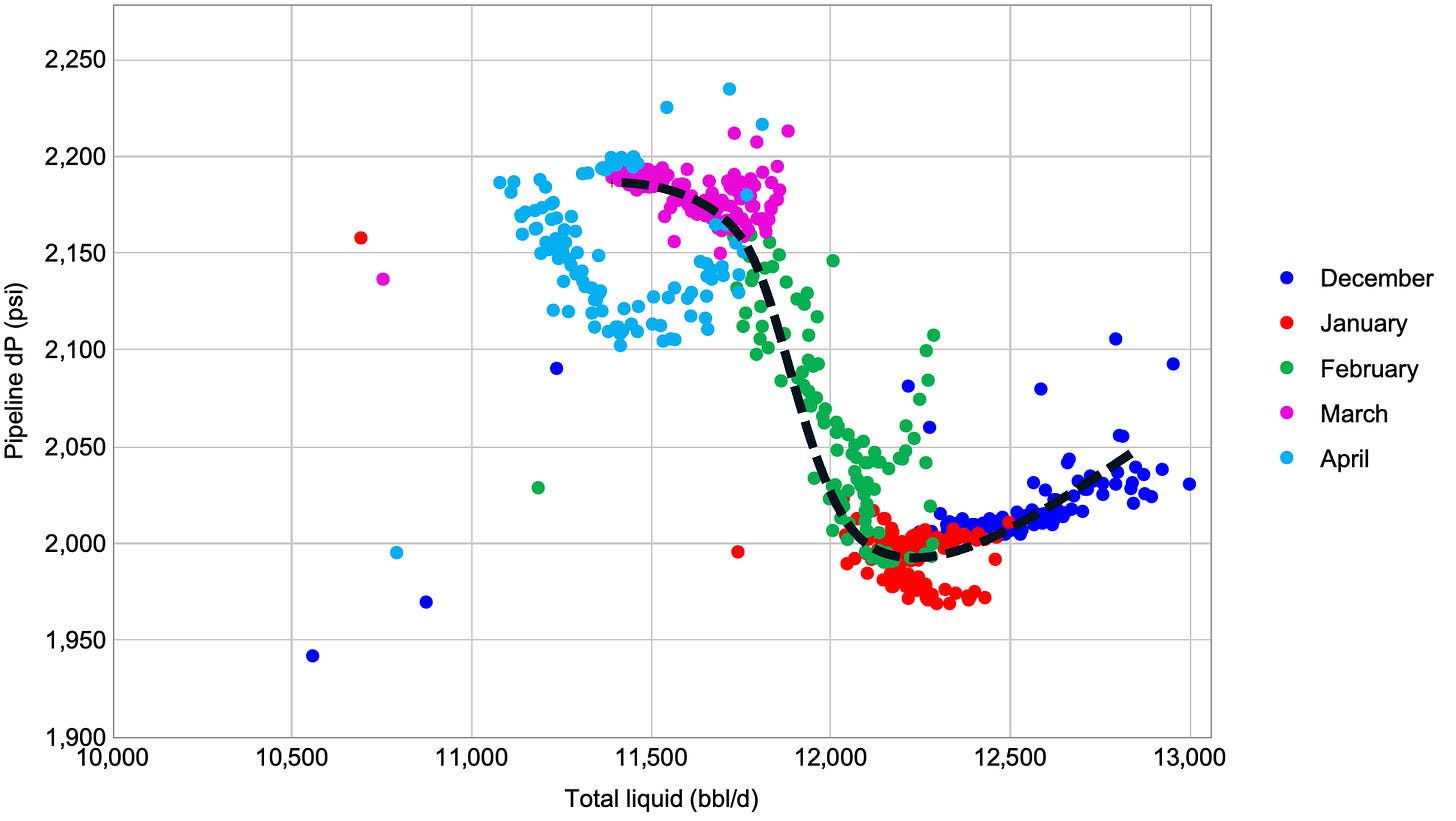
Below shows the pipeline dP vs. flow rates. Further, color-coding the production data (by month) adds discernment to the dataset. As total liquid rates increase, the pipeline dP should increase. This trend occurs in December, January, and partially in April. In February, March, and half of April, the trend is clearly pointing to a possible restriction forming.
Hydrates were quickly dismissed as arrival temperatures to the platform ranged 75 - 92˚F, far outside the hydrate region. The team were considering asphaltenes and paraffin as likely culprits. Typical asphaltene deposition challenges normally occur downhole in the wellbore area, and paraffin also appeared to be a low risk because the field was applying continuous paraffin inhibitor (PI) injection. We decided to look into paraffin.
If you recall from the figure at the beginning of the article, the measured WAT was 94°F and the wax content was 3.4 wt%. It’s worth pausing here to discuss the wax appearance temperature, as it turns out there is a lot to unpack here!
The WAT is the temperature below which wax destabilization (precipitation from the bulk fluid) occurs. There is a conservative school of thought in oilfield production that treats the WAT as the Mendoza Line for wax deposit catastrophe…above it and we’re golden; below it and the flowline is going to look like a candle in a week! (OK, maybe I’m exaggerating just a little).
When the pipe wall is at or below the WAT and there is a thermal gradient between the bulk fluid and the wall temperature, then there will be a thermodynamic driving force for bulk transfer of wax to deposit on the wall. So, a conservative approach is to assume deposition begins once wax is thermally destabilized. That’s the WAT, right?! It turns out that not all WAT measurements are the same. Different instruments will have varying degrees of sensitivities and limits of detection (LOD). In other words, a certain amount of wax must precipitate and accumulate before it is detected, and as these tests are conducted by cooling a sample the observed WAT is shifted to a cooler temperature than what the real WAT is. To account for this, some models will assume a certain wt% at the reported WAT based on the technique reported and will predict a wax precipitation curve based on a log-linear decay of paraffins.
A commonly used limit of detection (LOD) for DSC measured WATs in crude oil is 0.3 wt% (for reference CPM LOD is assumed to be 0.045 wt%). To be honest, there has been a tremendous advancement in DSC technology since those references were established and to my knowledge a reassessment has not been conducted or reported. We ran internal baselines with refined wax standards, and found 0.05-0.1 wt% LOD.
Why am I making a big deal about what seams like, a small percentage. Let’s look at the previously shown WPC generated via DSC for this field’s crude oil. The WAT becomes quite different depending on the LOD assumed: ranging 94°F - 166°F! That is a massive difference and severely different mitigation strategies will be employed for new fields depending on what number is used to make decisions.
What do these curves mean for the field in question? To answer that, we mapped the temperature profile of the flowline with two different well configurations and we overlayed the various WAT values based on LODs. If the LOD of the DSC used to run the WAT is 0.3 wt% (yellow dashed line) then the WAT is significantly upstream of the wellhead for Well 1 (blue profile). This seems unlikely.
For the Well 1 configuration, if the LOD is 0.1 wt% (dashed light blue) the WAT is near the end of the flowline upstream of the riser. This seems possible. And if there is no LOD (dark blue line), then the WAT is in the riser. This seems unlikely, as well, given we are seeing dP issues in the field!
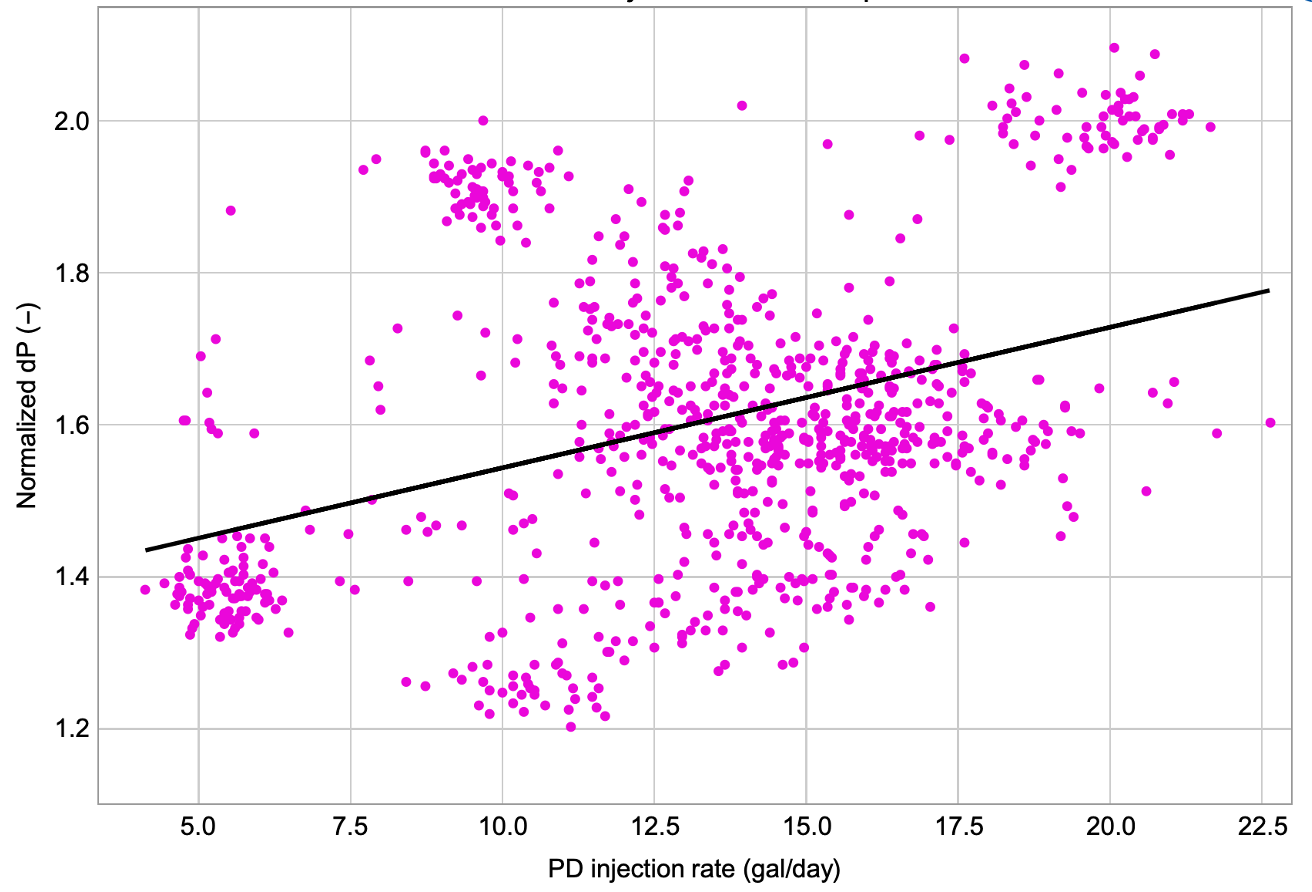
I mentioned previously the field was treating for paraffin. Based on this data, it was determined to qualify a new product. In fact, two chemicals had been applied during the dataset provided: a paraffin dispersant (PD) and a paraffin inhibitor (PI). The field had multiple injection points and were able to pump both the PD and PI intermittently without swapping the chemicals through the umbilical. And, in fact, the field had changed chemical injection rates often, including turning them off. We wanted to look for correlations that might suggest chemical effectiveness. First, we compared the PD injection rate vs. dP. The dP was normalized against a pressure when no chemical was applied, giving a relative baseline of 1.0.
At best, there is no correlation between injection rates and impact on dP. At worst, the dispersant may have been making the situation slightly worse. Next, we looked at the PI application. There is a much more clear correlation with higher injection rate and lowering the dP.
Given the continued increase in dP and a positive impact with an inhibitor class (PI), the chemical vendor worked to optimize the formulation. We confirmed chemical performance using a wax flow loop in the lab. Under dynamic, flowing conditions we are able to evaluate a crude oil’s relative tendency to deposit paraffin under steady-state flowing conditions. We found relative to the untreated scenario (blank), there was a minimum dose rate threshold below which the PI was unable to inhibit deposition, and above which a low build-up of dP was observed. The recommendation was to apply the new PI at a dose rate > 650ppm and optimize in the field.
The field implemented the recommendation with the new PI and began injecting at 850 ppm. We followed back up with operations recently and learned the new PI was working well. Since the new application, the field had not experienced increasing dPs without corresponding increases in liquid production.
So, what did we learn? it is likely the true WAT is closer to 105°F than 167°F given the changes in mitigation were not so severe as to require a massive intervention. After all, comparing the WPC at a boarding temperature of 75°F shows a significant difference in precipitated wax between the 167°F curve and the 105°F curve: 0.7 wt% vs. 0.1 wt%, respectively. If all the wax at 75°F were to deposit while producing 11,000 bbl/d that is a difference between 82.5 bbl/d wax and 11 bbl/d wax! Of course, it’s highly unlikely that would happen, however it does illustrate the huge difference in potential solids that could deposit in the flowline.
I’ll close with a comment on the new PI. Finding a chemistry that works is challenging, whether it is a product that has been around for years or it is a new, fit-for-purpose product specifically designed for one application. The incumbent product(s) are valid products in other fields, and at one time were the correct product(s) for this application. As a field ages or new wells are brought online, it is important to periodically ensure product selection and dose rates are optimal. And if the data points to swapping out chemistries, put in the hard work to find an alternative solution.


