Background
After a long couple of months, the NBA playoffs will be wrapping up soon. The finals are currently underway with the Dallas Mavericks facing the Boston Celtics.
Unfortunately, despite an impressive showing from the Mavericks last Friday night (winning 122 to 84!), the odds of them winning the series are most definitely NOT in their favor. Prior to Friday night, without a single win, they were down 3 games in the series to the Celtics. Historically, in NBA playoff history, out of the 150+ teams that have gone down 0-3 in a series, not a single one has come back to win the series.
But zooming out from just the finals, by all accounts, the entire playoffs this year were entertaining, with no shortage of games that seemed to come down to the last few minutes. One series in particular was the Celtics vs. the Pacers in the Eastern Conference finals, which was recently the focus of the weekly Fiddler on Proof Substack.
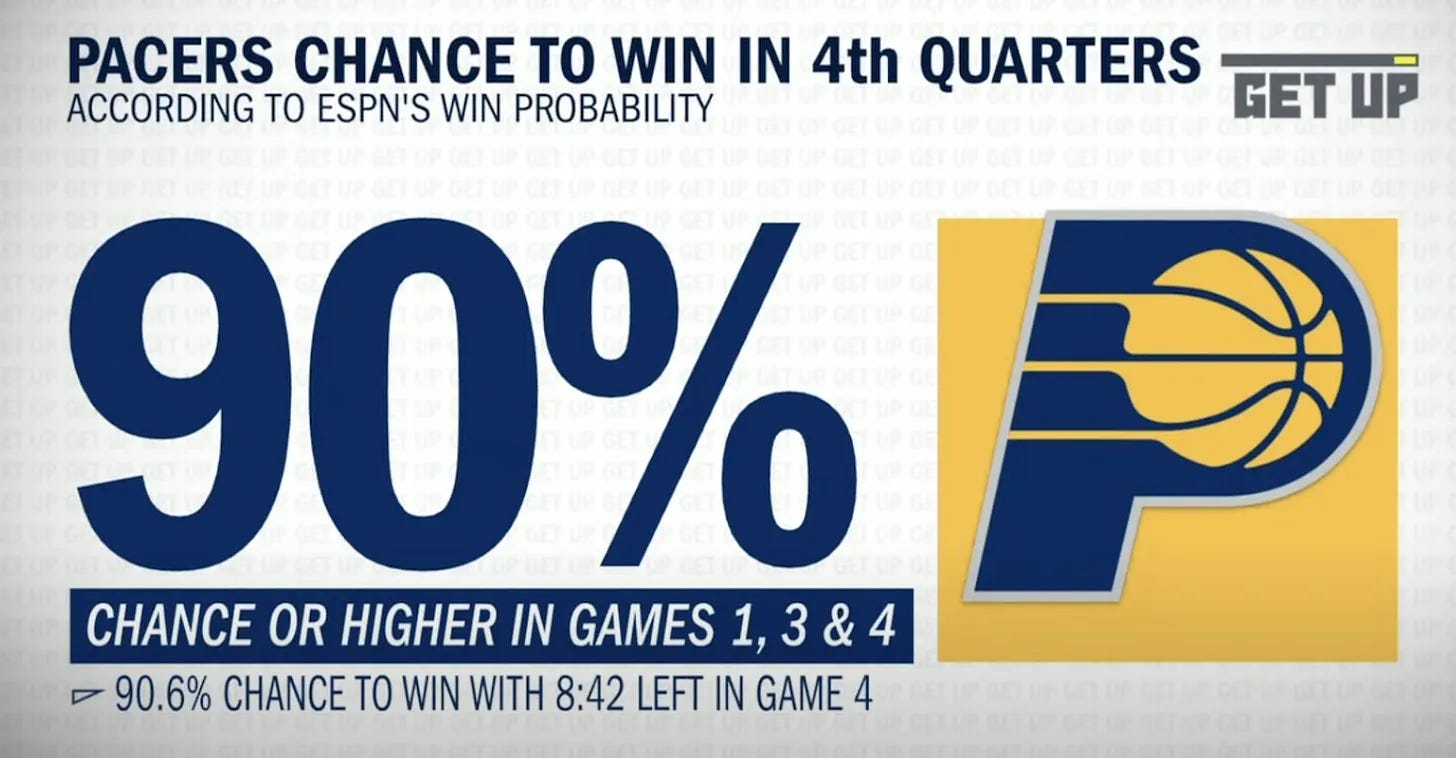
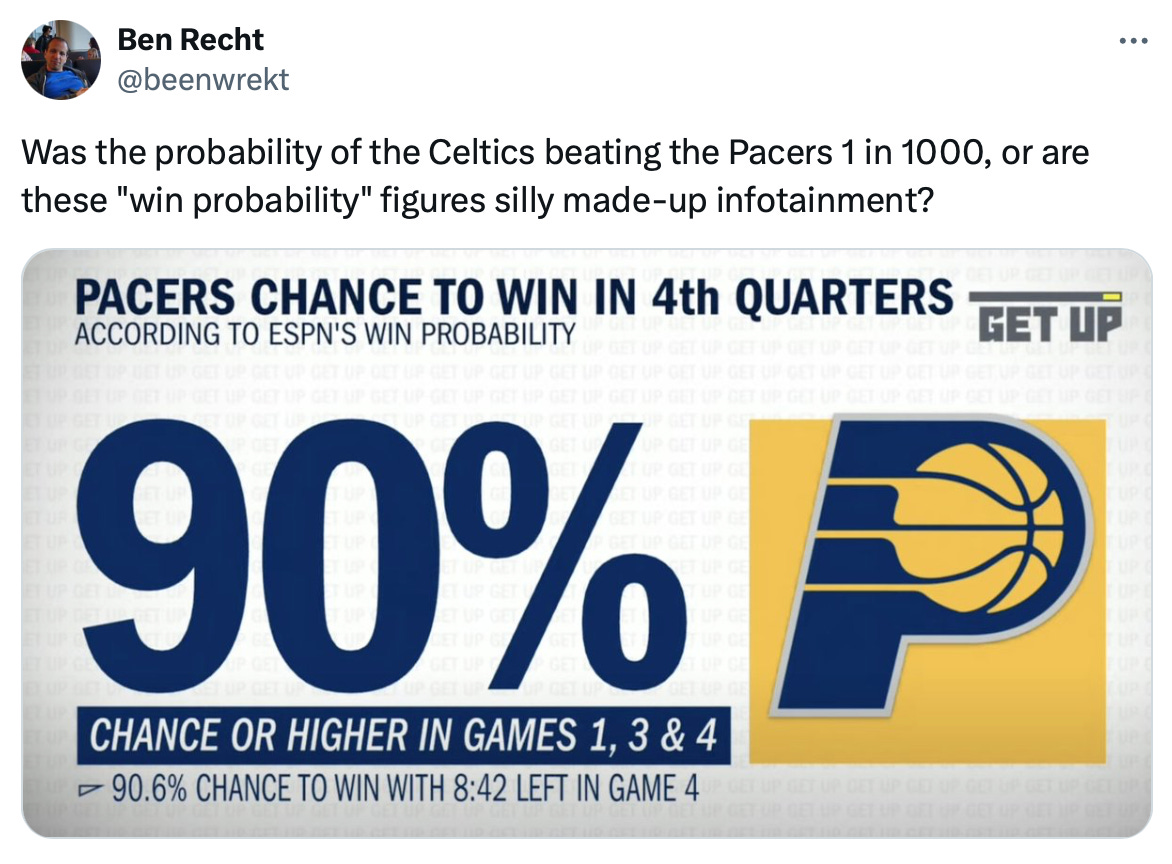
At the end of the series, ESPN put out the following graphic below showing that during Games 1, 3, and 4, there was a point when the Pacers had a 90% chance of winning, and yet, somehow, the Celtics ended up sweeping the Pacers, winning each of those 3 games, plus Game 2.
The win probability charts for those 3 respective games are below (Celtics in green and Pacers in dark blue), which gives an indication as to how exciting they were to watch, coming right down to a dramatic finish at the end.
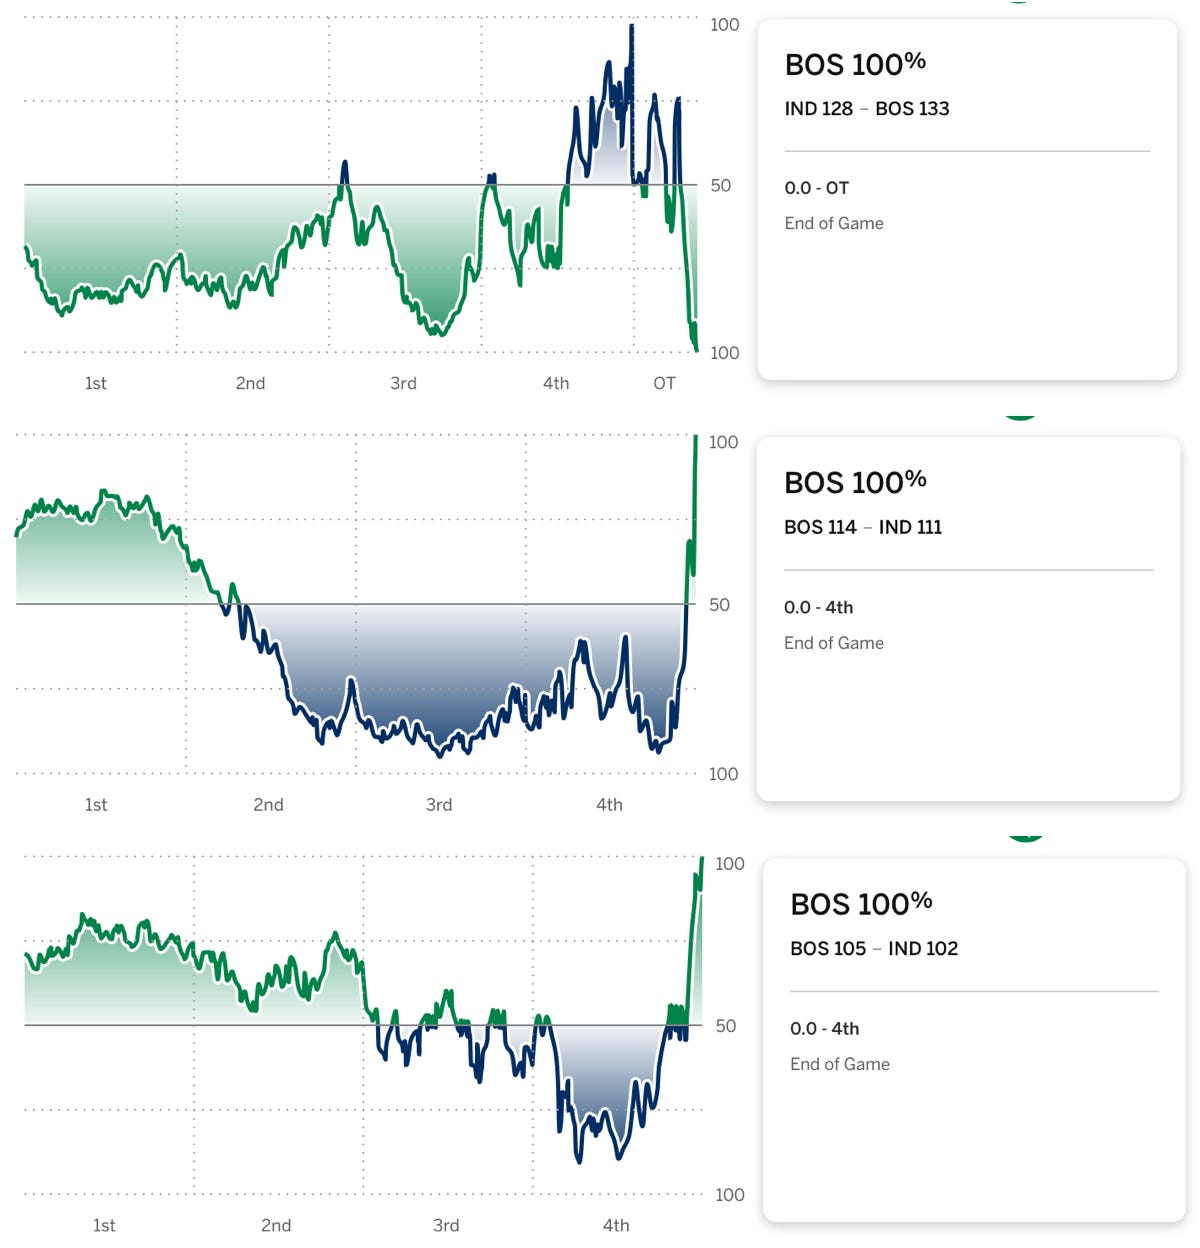
For reference, the win probability over the course of game 2 is shown below. Clearly a more “normal” game…
Seeing the Celtics come back from a 90% probability for the Pacers to win, not just once, but 3 times, naturally led some people to question the reported win probabilities.
Simple Analysis
Coming back to the Fiddler on the Proof post on this, is it possible to try and understand this using some kind of analysis? To start, what if we first look at a very simple scenario proposed by the Fiddler:
Let’s assume there are only 5 possessions in a game (don’t worry, we will revisit this assumption)
During a given possession, there is a 50% chance that your team will score (relatively representative of NBA teams)
If your team doesn’t score, then assume the other team scores instead
A score is worth 1 point to keep it simple
Analyze only the games where the opponent had a 75% chance of winning at some point in the game and then determine how often your team actually ended up winning
Common sense would tell us that if at any point the opponent had a 75% chance of winning, then your team should have had a 25% chance of winning.
With only 5 possessions, the possible enumerations of scenarios can be solved analytically, but I find it easier to approach these through computer simulations (and that will pay off when the analysis gets more complicated).
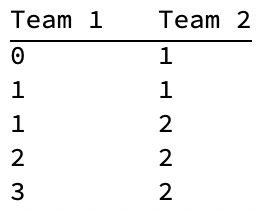
We can easily simulate a game here by randomly drawing five times from a Bernoulli Distribution with a probability parameter of 0.5. Taking the inverse of each value we return then corresponds to the opponent’s (Team 2) score. Accumulating both sets of values gives us the running score after each possession. In the example below, Team 1 wins, being the first to reach 3 points.
For each possession along the game, we can calculate the probability of Team 2 winning, which returns the plot below for this example.
In this example, after possession 3, there was actually a 75% chance that Team 2 would win, however, Team 1 ultimately came back to win.
If we scale this approach up, generating 100’s of games at a time, and then take only the games where Team 2 had at least a 75% chance of winning, we can then look at how often Team 1 came back to win it.
As mentioned above, we would expect this to be ~25% intuitively, but in fact it’s lower than that with an average of ~19%. The distribution of probabilities of Team 1 winning after Team 2 had at least a 75% chance of winning at some point in the game is shown below. While it varies from 5% to 35%, the average is clearly centered below 20% and nowhere near the expected 25%.
More Complicated Analysis
Were the results above just a result of the low possession count? Let’s try and find out by making the analysis more similar to an actual NBA game and in particular the Celtics/Pacers series:
Increase the number of possessions to 101, which is reflective of an actual NBA game
Maintain the scoring at 50% for each time while in reality the probability of any team scoring will be different than 50%
Analyze the Celtics / Pacers game by determining the probability of the Celtics winning in games when the Pacers had at least a 90% chance of winning at some point in the game
Just like the analysis above, we can do this again using simulation and most of the same logic. Here the use of simulation is important because the analytical approach given the combinations of potential scores on each possessions is huge.
We’ll start first with creating a single game to walk through the steps, this time with 101 possessions. It’s worth noting that unlike a real game where there is no limit on the score, in our simple example the winner is the first to reach a score of 51.
And the corresponding moving chart of win probability for Team 2 now starts to look more similar to some of the ESPN charts.
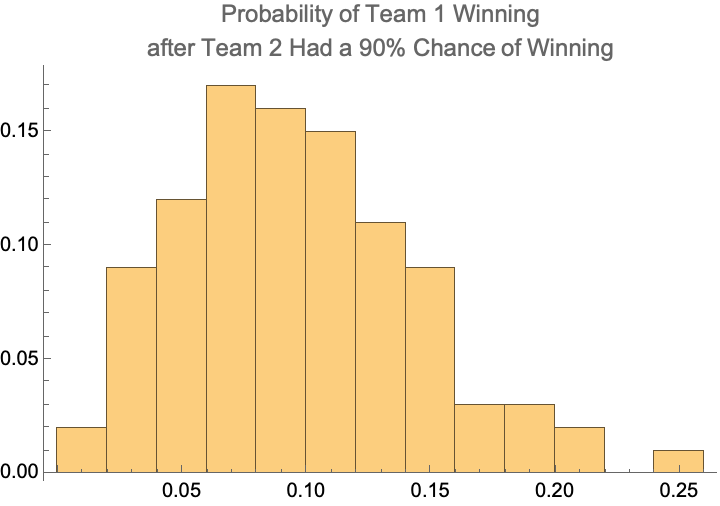
Just like in the simpler analysis, if we then generate 100’s of games at a time using these conditions and take only those where Team 2 had a probability of winning of at least 90% at some point in the game, we can calculate the fraction of games where Team 1 came back to win.
The distribution of probabilities that Team 1 comes back to win is shown below indicating an average of around 8%. Again, just like we saw in the simpler analysis, it is actually lower than what we would intuitively expect (10%).
Conclusions
Going into this analysis, I was expecting to find that if anything, the in-game probabilities were somehow easier to overcome than we might intuitively expect. This would explain why the Celtics seemingly did this 3 different times in just a 4 game stretch.
It’s entirely possible (potentially even likely) that this simplified approach was too simple, but what it showed was that it was actually harder to overcome the in-game probabilities. Potentially as the number of possessions increase, we see evidence that we may converge to the intuition i.e. with more possessions a 90% chance of Team 2 winning would correspond to a 10% chance of Team 1 winning.
In either case, it would appear that what the Celtics did against the Pacers was in fact close to a 1 in a 1000 type event and therefore pretty amazing!





Awesome breakdown, Andrew! Appreciate you explaining how those ESPN projections work. I'm a big Pacers fan, watched most of their games this season, so it was a tough read. Ha!
As I think about where analytics and reality collide... While I think the analytics captured Game I correctly (the one we coughed up), at no point in those other two games did I feel the Pacers have close to a 9 in 10 chance of winning. As the better team, Boston's ability to ramp up their game (which they did) in the minutes that matter is a real outcome that's hard to nail in a make-miss model. All that aside... that the Knicks had a 0% chance of winning the Pacers-Celtics series is the only statistic that mattered! :)