Image Processing for WAT Determination
KAT & Pontem partner to enhance WAT measurement, repeatability & application
Old Friends
As Pontem expands its global operations in Europe and the Middle East, it was a natural progression for us to reinvent our relationship with Kernow Analytical Technology (KAT). As a first example of our combined capabilities, we have taken our specialized strengths to enhance the reliability of wax appearance temperature (WAT) measurements in hydrocarbon fluids. By merging KAT’s state-of-the-art laboratory capabilities with Pontem Analytics’ advanced data-driven insights, this collaboration has unlocked higher levels of precision and confidence in measuring a fluid’s WAT. Working together, KAT and Pontem offer an innovative holistic data driven solution in WAT measurement and analysis. This partnership exemplifies how combining laboratory expertise with modeling & data analytics can lead to impactful solutions for the energy industry.
Background
Cross polarizing microscopy (CPM) is a technique used to enhance the contrast of transparent or semi-transparent samples by using polarized light. In this setup, light is first polarized in one direction by passing it through a polarizing filter, and then it passes through the sample. A second polarizer, called the analyzer, is placed in the optical path but oriented at a 90° angle to the first one. This "crossed" arrangement blocks most light, allowing only light that has been affected by the sample to reach the viewer.
In cross polarizing microscopy, certain materials with birefringent properties (those that have different refractive indices in different directions) rotate the polarized light as it passes through. This rotated light can then pass through the analyzer, creating high-contrast, colorful images of features that might otherwise be invisible. It’s widely used in fields like geology, material science, and biology to study crystal structures, fibers, minerals, and biological tissues.
In the context of oil and gas, CPM is used extensively to help identify what is referred to as the wax appearance temperature (WAT) of an oil or condensate sample.
The Age Old Question - What is the WAT?
Knowing the WAT of your fluid is critical to identify the temperature where wax may start to precipitate in solution or deposit on the pipeline wall, both of which can have negative (and costly) implications for operations. But as it turns out, getting a correctly measured WAT can sometimes be a challenge. In fact, we have written on that exact topic in past articles.
As we discuss in that article, what can make measuring the WAT challenging is that there are multiple different methodologies, each with different procedures, detection thresholds, and varying potential for interpretation errors.
The three most common methods for determining the WAT, along with their relative strengths / weaknesses are summarized below:
Cross Polarizing Microscopy (CPM)
Overview - Imaging approach to visually identify wax crystals as the fluid is cooled
Strengths - High fidelity (industry-accepted detection threshold: 0.045 wt%)
Weaknesses - Subjective results
Differential Scanning Calorimetry (DSC)
Overview - Heat flow associated with phase change is measured as the fluid is cooled and used to identify the WAT
Strengths - Easily automated, repeatable
Weaknesses - Lower fidelity (industry-accepted detection threshold: 0.3 wt%)
Viscosity Measurements
Overview - Viscosity of the fluid is measured as it is cooled to identify when an exponential response is observed due to the precipitation of wax particles in the fluid which illicit a non-Newtonian response in the fluid
Strengths - Easily automated, repeatable
Weakness - Lower fidelity (industry accepted detection threshold not established)
As we look on the various strengths / weaknesses, what we can see is that the bottom two really excel in the areas of repeatability and automation. While CPM would be a clear favorite in terms of fidelity and the ability to truly measure some of the very first wax crystals precipitating.
Knowing this, we teamed up with KAT to investigate whether there is a way we can improve the CPM method as a whole, by introducing some automation and repeatability, while also helping to reduce the subjective nature of the test interpretation. Overall, our goal is to create the best possible industry measurement for WAT.
A Deeper Dive on CPM for WAT Measurement
When using CPM to determine the WAT, a sample will be heated to well above the WAT, allowing all wax crystals to melt completely in solution. Following that, it is cooled slowly at a predetermined rate.
As the cooling occurs, images will be recorded at regular intervals. Following the test, the scientist will review the images and typically utilize his or her own judgement in determining the point at which the very first wax crystal becomes visible in the solution, calling this the WAT.
This is where the subjective nature of the test is exposed. Luckily KAT has been doing this for decades and so they have great eyes for correctly identifying the WAT. However, there can still be a need to provide an automated second opinion.

Image Analysis to Compliment the Scientist
To enable an automated approach to identifying the WAT via CPM, image analysis can be used to help us determine when we first see a significant change in the images as the fluid is cooled. The high-level approach is the following:
Binarize the image - most images you take with your phone or see online are in color, where every color in that image is some blend between red, green, and blue. To help make it easier to determine a change in our image, we can binarize the image, essentially converting it to black and white.
Average each pixel - once we’ve binarized the image, we can look at it’s average pixel value.
Difference each image from the base - after obtaining an average pixel value, we can subtract that value from the very first image in our set (the warmest temperature).
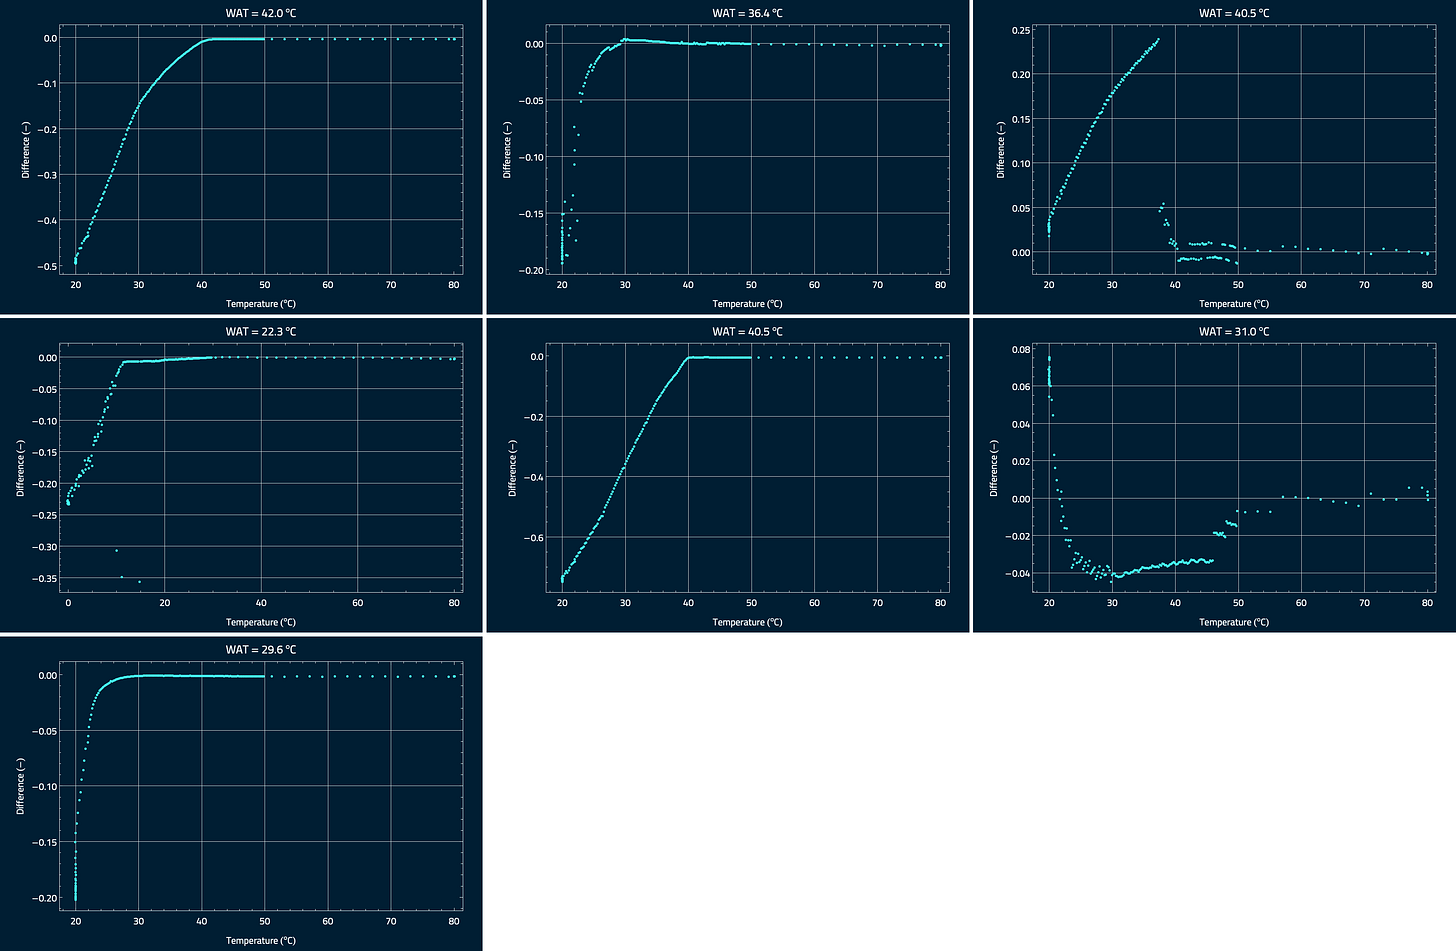
Once these 3 steps have been performed, we can obtain various plots showing us how the average image value changes relative to the starting value as a function of the fluid temperature. Reading the plot below from the right to the left, we can automatically identify when we have our first significant deviation, which indicates the WAT.
In the plot above, the WAT was determined to be 42.0 °C, very close to the estimate of KAT’s ‘eagle-eye’ scientist at 42.5 °C. The images below confirm the very first wax crystals emerging around this temperature.
What About Something A Little More Challenging?
The example above, could be considered an “easier” identification of the WAT because the wax crystals become apparent suddenly at one temperature, as opposed to gradually. And the images themselves are clean, meaning the oil is free from any contaminants.
So how does this approach perform on a more difficult set of images?
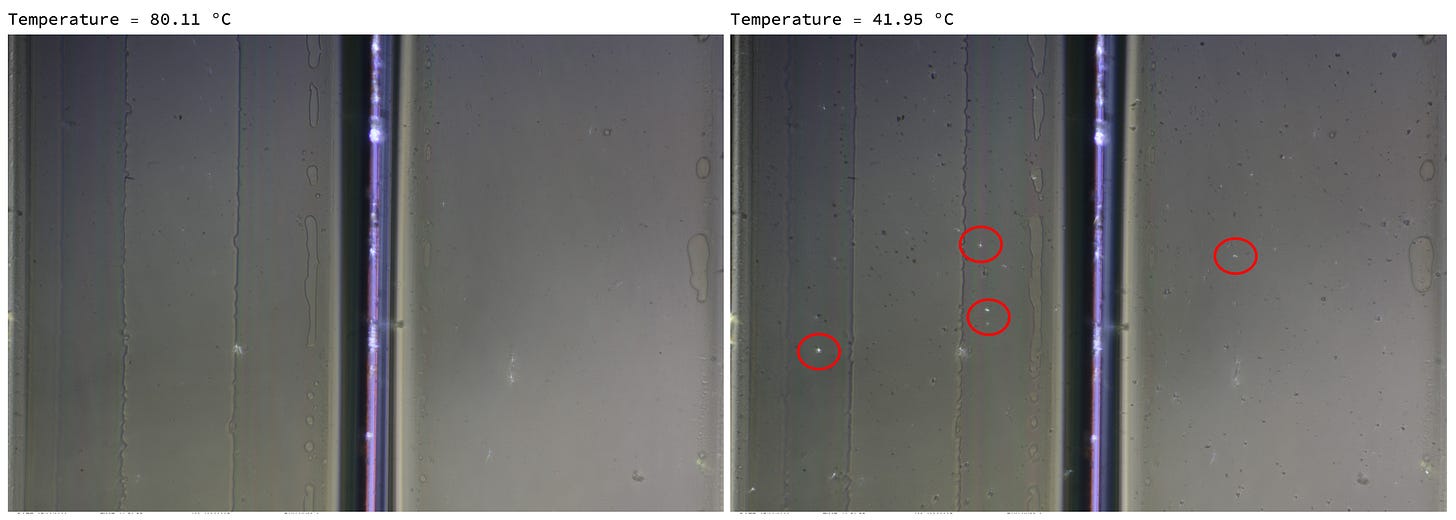
Below are a few of the images at varying temperatures from a more complicated oil to identify. We can see where some of the images, even at 80 °C, have some clear light sources that could be mistaken for wax. However, these are actually small amounts of water and other particulate matter in the sample. As you can imagine, these can make it more difficult to properly identify the WAT. An inexperienced person running this test and interpreting there results, could even conclude the WAT is 80 °C, which would be very wrong.
Running the algorithm on these samples returns the plot below, where we can much more easily see exactly where the true deviations begin to occur, this time around 40.5 °C. It would have been easy to choose something as much as 10 °C or even 20 °C higher via manual examination, which can have significant implications for a project’s design with respect to mitigating potential wax issues. The algorithm also helps to provide support for the selected WAT, which in this case was selected by KAT to be 41.5 °C.
Overall Performance
The algorithm has now been run and compared to several WAT analyses performed in partnership with KAT. In all cases, the algorithm performance matched or enhanced the WAT determination by KAT’s team of expert scientists. We believe this algorithm not only standardizes the approach to WAT determination, it is also complimentary to the work of a scientist, helping ensure the final stated WAT is as accurate as possible and reducing the timescales required for interpretation.
At Pontem, we have also utilized the algorithm to improve the estimated WAT when a separate 3rd party lab performed CPM on an oil sample and it was speculated that the WAT was over reported at 27.2 °C. Upon running our algorithm, we concluded that the WAT should actually be <10 °C, resulting in a vastly different outcome for the project, which was in design phase at the time.
Partnership with Kernow Analytical Technology (KAT)
The partnership between KAT and Pontem Analytics sets a new standard for repeatability, accuracy and operational insight. By integrating best-in-class laboratory practices with advanced data analytics, both companies have demonstrated the powerful impact of collaborative innovation.
Operators now have access to more reliable wax appearance temperature measurements, empowering them to make informed decisions that reduce risks and enhance the efficiency of hydrocarbon transport and processing. As the energy industry continues to evolve, partnerships like this one will be essential in addressing complex challenges with precision and confidence, reinforcing a commitment to safety, sustainability, and progress. We are looking forward to our future projects together.


