My first experience at the Wolfram Technology Conference (WTC) was in 2015, and with only a few exceptions, I’ve had the privilege of attending nearly every year since. Over the years, I've also frequently submitted abstracts and delivered presentations, and this year is no exception.
WTC is a great conference devoted to sharing topics and ideas revolving around the Wolfram Language, which is the programming language developed by Wolfram Research.
The conference includes a mix between Wolfram developers presenting upcoming additions to the language as well as academics and industry professionals showcasing the use of Wolfram technologies. And the best part is that each presentation is roughly 25 minutes, which means you can attend a lot of presentations, absorbing the high-level points on a huge amount of information.
Here’s some of the highlights from various talks:
Tabular (!!!)
I consider myself a Wolfram Language evangelist, but unfortunately when R and Python users start talking about data frame capabilities and “tidy data”, I don’t have much to add because the Wolfram Language has lacked in this space. That was until now…
I’ve been following Wolfram’s live streams on Youtube where they talk about software engineering and the design of their language openly, so Tabular was not a surprise to me, but it was however, the first time I really got to see it in action and have the team walk through the functions built around it.
So what is a Tabular?
Well, as I alluded to above, it’s Wolfram’s long awaited answer for efficiently dealing with “tabular data” or data that fits nicely into rows and columns (think CSV’s, TSV’s, or anything in Excel). This data format happens to be the most common form that data exists in and is the reason other languages have constructs referred to as data frames.
What is special about Tabular’s?
When you make the concession that data is only allowed to be rows and columns (2D), it suddenly means that you can employ all kinds of tricks to a.) increase speed when working with the data and b.) reduce size when storing the data. In short, Tabular’s will be very efficient!
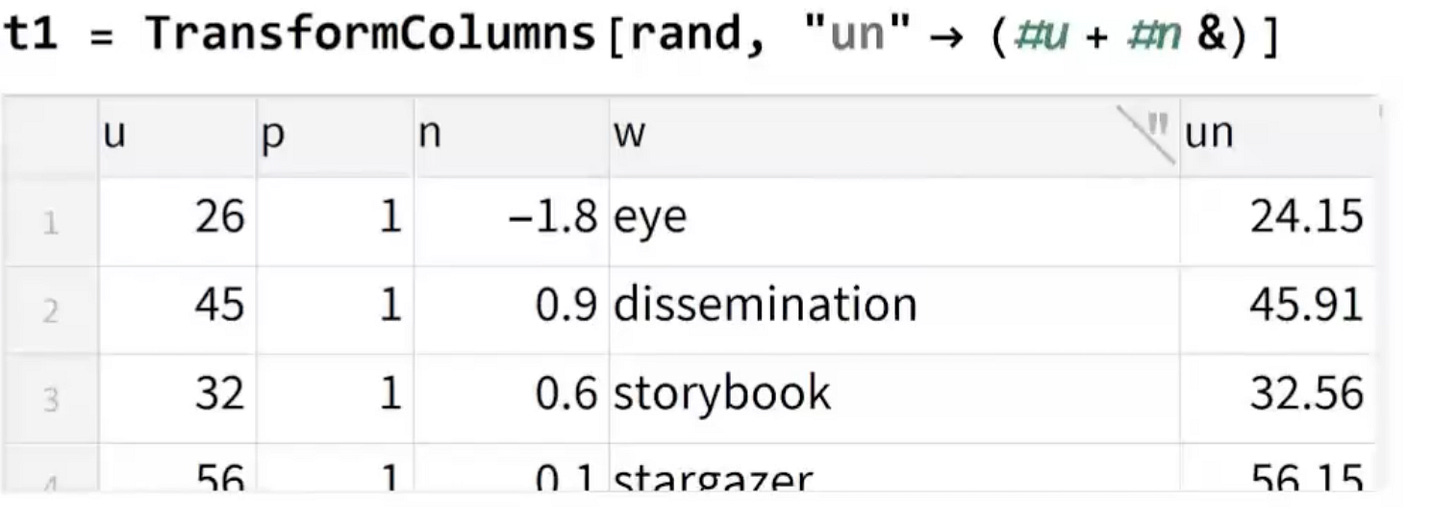
Tabular’s will also have a few new functions that can operate on them directly to either manipulate and add new columns based on calculations of existing columns, or to aggregate rows and perform multi-level calculations. These two operations are the most common types of things you end of doing with tabular data.
I could go on about Tabular’s forever, but I can already tell I’m going to be using them everyday and I’m excited they are a new addition to the language.
Tabular Visualization
Ok, one more note about Tabular’s actually. Because Tabular’s are being introduced as a first class object within the Wolfram Language, they are also being supported directly by a broad range of existing functions, which includes things like modeling, but also visualization.
Tabular’s can now be passed directly into most visualization functions and there is a new syntax that will let you easily specify exactly what variables you want plotted from the Tabular.

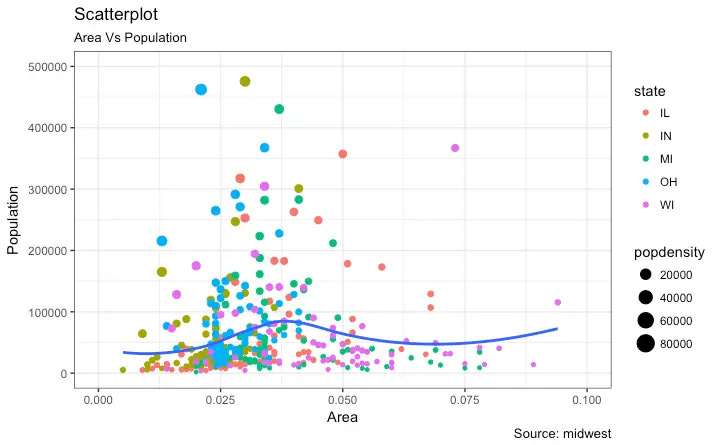
This is another area where Python and particularly R users have had an advantage in the past. The ggplot library in R, for example, has a very powerful but straightforward way of creating data visualizations when you can rely on the data being 2D. All the various attributes of a plot i.e. X and Y axis, colors, markers, etc. can all be “mapped” to a particular variable or column within the data frame. ggplot gets it’s name from the “grammar of graphics” which is essentially a language for building up the layers of a graphic.

Now, unfortunately the Wolfram Language so far will only support position encodings i.e. what variable is on the x and y axis, but I did hear one of the developers mention that their long term plan is to support other types of encodings too. This likely means that eventually the Wolfram Language will support a very similar syntax as ggplot (I hope).
Backends for Neural Networks
The Wolfram Languages support for neural networks is unique. It treats neural networks as symbolic objects, which means that individual layers can easily be manipulated, replaced, or dropped altogether rather efficiently. Something which is less easily done in other frameworks.
However, when it comes to training a neural network or using a neural network for inference i.e. evaluating it, Wolfram must use a 3rd party backend. The reasons for this is that the training of a neural network, is a particularly complicated process that relies on the differentiation of matrices. Since the addition of neural network support a few versions ago, the backend that Wolfram has used is MXNET. And while that is a lesser known deep learning framework, it has seemingly gotten the job done for Wolfram previously.
However, it was relatively recently announced that MXNET was being retired, meaning that future support for it would be dropped by the developers and supporters. This has prompted Wolfram to look for another backend to support their neural networks.
And the developers have selected PyTorch to be the new backend and work is ongoing to enable this. PyTorch is one of the most commonly used deep learning frameworks in the world, so personally, I am excited to see this be selected. I think going forward, it will ensure that the Wolfram Language neural network capabilities keep up with the latest in the space and receive proper long term support. Future versions may also look to incorporate additional backends such as Tensorflow, which would also be a great addition.
LLM’s
Large Language Models’ (LLMs) are seemingly everywhere these days, so why wouldn’t they exist within a Wolfram Language notebook??
In all seriousness though, the developers at Wolfram have made a very interesting and compelling case as to how they can be used in parallel with the Wolfram Language. You can directly ask the LLM for help in writing your Wolfram Language code, or you can use it for more traditional tasks such as writing your next essay, all within the notebook interface.

Jupyter notebooks got their idea from the Wolfram notebook, which was first developed over 30 years ago. And while Jupyter notebooks have progressed at a rapid pace to include all kinds of functionality, they are far from having the same level of capabilities that Wolfram Language notebooks have. And this now takes that separation a bit further still.
Industry Presentations
Just like in year’s past, there were plenty of great industry presentations as well, talking less about new features, but rather how to utilize the Wolfram Language to solve real world problems. Some examples included:
‘Pumping stations optimization’ which talked about the combined use of Wolfram Language and System Modeler (another Wolfram product for creating models and simulations of real world things) in helping to optimize pump stations for a complex water distribution system.
‘Data-Driven Website using Wolfram Language’ showed how a complete interactive website can be created using only the Wolfram Language
‘Leveraging the Wolfram Cloud to Deploy Tools in Excel’ by yours truly talked about how we at Pontem deploy API’s in the cloud and call back to them from things like Excel.
That’s a Wrap!
It was another good conference this year, and just like year’s past, I was glad to be able to attend and soak up some of the information. I’m looking forward to next year’s WTC!


