Good Vibrations
Deepwater Startup - Case Study: A "Funky Bunch" of Wells
Anyone working in the oil patch knows the “fun stuff” always seems to happen at the worst times: nights, weekends, holidays, end of the quarter, end of the year, while you are on vacation, etc. Never a dull moment and shout-out to all of the energy folks who work hard to keep our lights on 24/7 and spend time away from their families, in the field on a rig/supply vessel, or even just being always “on” and ready to help out as-needed.
Our latest case study is no different - starting up new wells against a ticking clock.
Fast Track Project
Now the time has come for you to get up…
Bringing on new wells into existing infrastructure offers the allure of a ‘fast-track’ project execution. Discovery to first sales in reduced cycle time helps to monetize the resource quickly, ultimately reducing the break-even commodity cost. Finding a “home” for potentially stranded assets by leveraging timing of production decline and market availability on equipment/installation windows.
Some of the enablers of finding a good home - quickly - are:
Brownfield developments - available ullage on existing assets, within reach of smaller reservoirs that can be produced economically (i.e. sufficient recovery/EUR) and hydraulically feasible (i.e. sufficient pressure)
Known reservoir - relying on ‘analogue’ data as a proxy for what the reservoir is likely to produce (composition, contaminants, pressure/temperature, gas/oil ratio, etc.). The need for extensive appraisal programs to assess how the reservoir will behave doesn’t work in a ‘fast track’ approach.
Standardization - using existing design specs or even available (spare) equipment, that will be a fit-for-purpose solution. Trees, jumpers, meters, valves, pipelines. All intended to work within specifications for the likely fluids, without need for long-cycle engineering programs to re-invent the wheel.
Engineering efforts become laser-focused on those key variables (or key components) that are potential problems areas if our assumptions change. As Ronald Reagan said, our approach is “Trust, but verify”.
Did you know: Trust, but Verify is actually taken from a Russian proverb “доверяй, но проверяй”, which is super-ironic given that the Regan quote was most famously used to discuss nuclear disarmament with the Russians…
Flowback Data
Yo, it's about that time, To bring forth the rhythm and the rhyme
In this example (deepwater subsea tieback into an existing facility), engineering efforts including production / flow assurance began ~24 months before startup. Alignment and Basis of Design (BOD) development relied on best guesses / assumptions to complete project economics and get equipment ordered. This focused largely on reservoir estimates and production rates, which drove the system design. A reasonable starting point and not uncommon approach.
12 months later - after the project was sanctioned and engineering progressed into detailed design / fabrication - downhole samples were collected as part of well completion efforts. Compositional data was obtained and nothing big/scary was identified (no H2S, etc.). However, a few things did stand out:
Reservoir was gassier than anticipated. No major impact on the production side, but gas just ‘eats up’ frictional dP losses when moving oil. This adds mass to the system, increasing the overall in-situ velocity and cumulative momentum for the same bbl of oil. We will come back to this…
No detailed PVT assessment (i.e. CVD/CCE/DiffLib) was done, beyond reservoir conditions. Again, not a big problem, as Eos models are typically leveraged to fill in the gaps at operating pressures/temperatures. However, we should ensure alignment on the EoS approach adopted, so there is a consistent basis for in-situ properties across all disciplines. We will come back to this too…
PVT is different between the two candidate reservoirs / wells. While they are in close proximity (geographically), they are different (geologically). So, now we have to manage on a well-by-well basis, as well as an optimized total asset basis.
Flow Induced Vibration (FIV)
It's such a good vibration, It's such a sweet sensation
As we progressed through the design, one potential issue was flagged: Flow Induced Vibrations (FIV) in the subsea equipment. Simply put, FIV occurs when fluid flowing through a pipe generates enough kinetic energy (i.e. high velocity turbulence) that can force the piping system to vibrate. Ultimately, FIV can lead to a degradation in fatigue life for the component in question, leading to failure. In our case, we will focus on subsea well jumpers.
This is not a new phenomenon so is relatively well-understood, and was assessed by engineering contractors (not Pontem!). Our role was to provide in-situ flowing conditions (gas / liquid phase velocity and density) and work with the equipment design team to assess loads/stresses on the individual components.
Work was carried out to define the acceptable flowing conditions, based on a Constant Amplitude Fatigue Limit (CAFL) and then, in turn, convert that to an acceptable force limit (i.e. momentum), defined by rho-V². This makes sense: the higher impact we have on the pipe, the more at-risk for potential movement. And, we now have something we can turn into a practical, observable, and measurable criteria.
In this particular instance, we need to keep momentum [rho-V²] < 5500 Pa.
(We will spare you the details of where the actual momentum criteria comes from, as well as the design/safety factors involved. But, the engineering contractor responsible for stress work on the jumper would be the best resource. Let us know if you want their details, they were an excellent collaboration partner).
Potential Mitigations
In order to reduce our FIV exposure, we need to keep the rho-V² < 5500 Pa. Options are fairly straight-forward / simple:
Reduce rho (in-situ density):
Manage gas / liquid ratio (no control over this and difficult to predict/measure)
Operate at lower pressures (limited effect for high liquid loading)
Reduce V² (in-situ velocity):
Flow lower rates (conflicts with basic economics!)
Operate at higher pressures (may conflict with density criteria above)
Design larger flow area (too late for ‘Fast Track’ projects)
Take credit for overdesign / safety factors (i.e. increase the 5500 Pa limit)
The “it will probably be fine” approach, where the asset’s field life is only 10-20 years…and we have 10X (or 100X) design factors, so we can start to eat into those margins. And, if there is detailed monitoring / inspection programs (i.e. ROV surveys, add accelerometers or other weight-bearing devices, etc.), can we get more comfortable with a less conservative approach?
This is a common theme when looking at ‘fast track’ projects - is part of the inherent approach that we can be less conservative? Or, because we are accelerating the development and realizing the up-front costs savings, do we need to be MORE conservative in areas like this? Good topic of debate.
With all the competing factors, we quicky become limited in what knobs can be turned. The velocity (V²) term is squared, so this may be the best variable to focus on.
Visualizations
With the information related to FIV, we found that our target production targets would violate the 5500 Pa criteria. So, now was time to map out what we could do. The need to share this information widely across the asset and engineering teams necessitated a wide parametric matrix of what conditions were possible, as well as the need to show this clearly and simply.
The engineering calculations (multiphase flow hydraulics, momentum calculations) were easy. The discussion around what the data told us - and how to use it - was not. Enter Heat Maps.
A previous Pontem post on Heat Maps discussed how amazing they were. The post did a good job explaining how they can be used for visualizations and creating good info-graphics.
And for this exercise, we did try to progress from ‘simple’ (old school) visualizations into more ‘exotic’ (new school) heat maps, capturing the combination of operating pressures, flowrates, and resulting momentum (rho-V² limits) in a single graph. A version of this was integrated into the control system.
More Visualizations
We did take a stab larger variable sets, extending to 5-D plots by adding in other variables (temperature, water rate, time of day, etc.), trying to take this to the next level. These variables all had (loose) correlations, but added no real value beyond being able to boast about generating a 5-D plot. There is A LOT of that going on these days because its easy to do…thanks Python!. The fact that we CAN generate 5-D plots doesn’t mean we SHOULD. In most cases, an exhaustive variable matrix just doesn’t have the data to draw interesting relationships that are usable, beyond a “hey, look at my 5-D plot”. It is plotting narcissism run wild…
Moreover, when we shared the plots with operations, we were met with “ok…but how can I use it to make decisions?”. The data was there - and looked great - but it was not easily digestible with the other considerations that operators had on a daily basis. We had made some pretty, but useless, graphs.
I am reminded of a quote from this year’s college football season, when an obviously overhyped Colorado team - the early media darlings - was blasted by Oregon. Colorado had been celebrated for a few early (and flashy) wins . They were the next “Big Thing” and the hype machine rolled on…before the rest of the football world finally realized it was without substance as the proceeded to lose 8 of their last 9 games, ultimately finishing in last place of the conference.. The quote speaks to what we are going for with how we display data: pretty pictures or pertinent information?
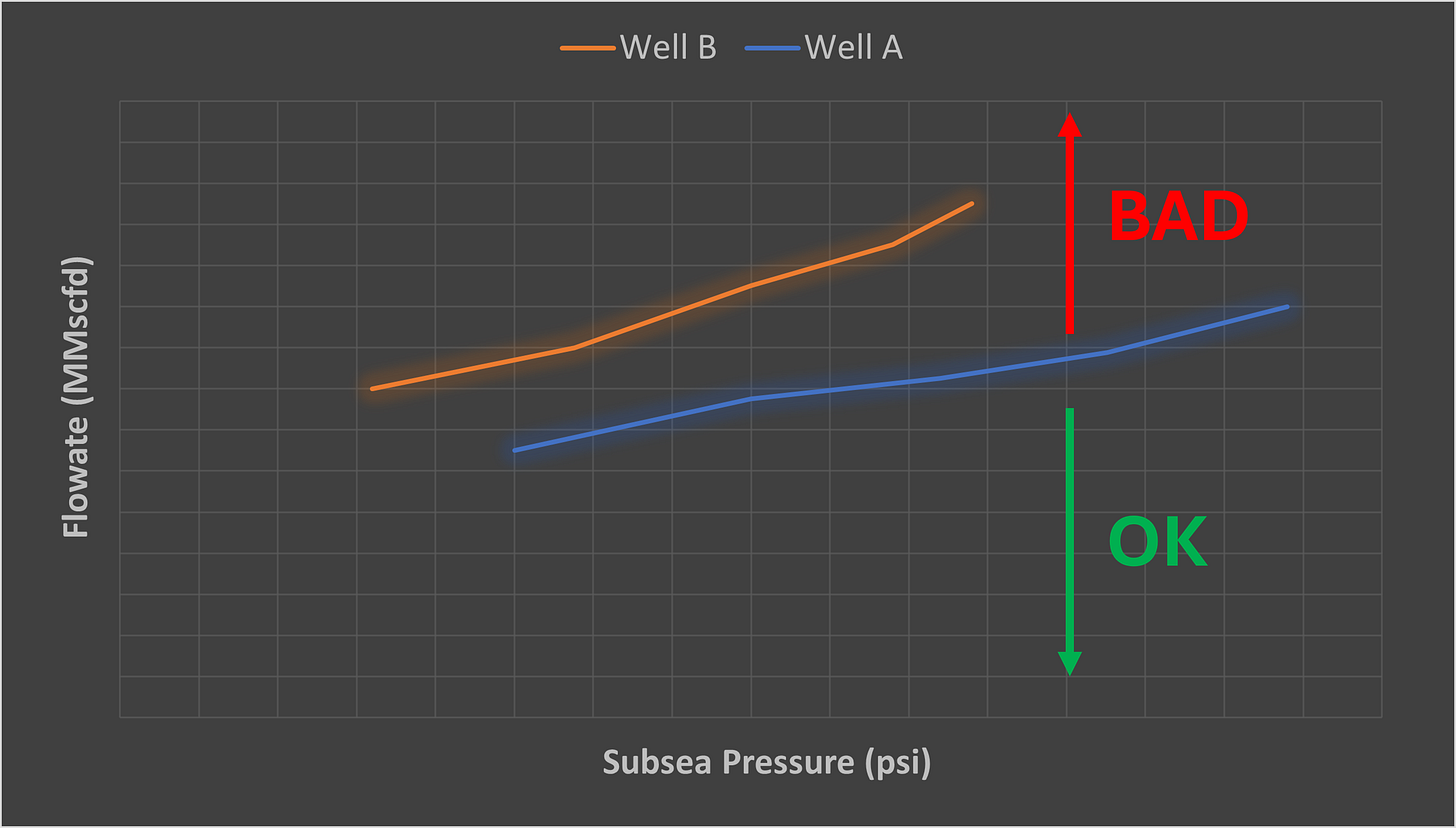
Where we ultimately landed on the FIV risk visualization was embarrassingly simple. Two things jumped out:
We need to anchor this to something we can observe/measure in the field.
We need to give an “on/off” limit for operations. No interpretation (there is too much else going on)
Rolling months of engineering work /operations discussions together, we give you:
This won’t get the most “clicks”, but it was a “win” for operations. We listened to the operations / field teams and took their feedback, rather than trying to tell them what they needed. Keep it simple, stupid (K.I.S.S.). A lesson that is easy to lose sight of: focus on offering more value, rather than just more features.
Field Data (FIV)
And I'm here to prove to you, That we can party on the positive side,
And pump positive vibes, So come along for the ride
Ultimately the decision was made to bring on the wells at a higher pressure, in order to control our in-situ velocity (V²), thus limiting the FIV exposure. This was a relatively easy decision since we had the initial reservoir pressure to do so. It also solved some other issues (topsides velocity / erosion control and maintained boarding temperature). Not the worst outcome, but one that was necessary (not optional).
A newly-revised and detailed start-up plan was developed for each well to advise on how to bring the well on (vs. boarding pressure) during the initial flowback and build-up periods, all keeping the jumper criteria in-mind.
The benefits of developing an integrated thermal/hydraulic model to work through different startup scenarios provided to be a valuable alignment tool between asset, reservoir, and subsea integrity.
PVT Impacts
One specific lesson learned through the process is related to the ‘source of truth’ on PVT data. As noted , the FIV limits were translated into a momentum (rho-V²) criteria. The only ‘measured’ values are the topsides gas/liquid rates, as well as subsea gauge pressures/temperatures. We are not actually measuring density (rho) or velocity (V²). So, we needed a mechanism to calculate those variables, especially getting an estimate of our in-situ velocity. Two options:
Rely on subsea multiphase meter (MPFM) information, which contains estimates for in-situ gas volume fraction (GVF).
Rely on EoS model predictions to estimate in-situ GVF.
In theory, these should be the same. In reality, they were not. EoS tables were developed by the project team and the MPFM vendor, but not synched together.
Since no detailed PVT testing was done to define the in-situ GVFs, everything was based on model prediction. While the two characterizations matched reasonably well on their phase envelope boundaries (tuning to the one, single data point that was available), they began to deviate at the areas of interest. The data being referenced in the multiphase flow meter (MPFM) was not the same as what was being used in the engineering assessment, including the data used to determine FIV limits.
What is the impact of this on FIV limits? Well, quite a lot:
MPFM Data: 0.854 GVF, 11.4 kg/s gas, 4.12 kg/s oil, +20% rho-V²
EoS Data: 0.768 GVF, 9.5 kg/s gas, 6.6 kg/s oil
While the GVF change (0.85 vs. 0.77) doesn’t appear large, the translation to the in-situ velocities (on a squared basis) does add up. In order to keep the FIV limit criteria, we need to continue raising operating pressures or curtail gas rate. Just based on the differences in EoS interpretation. An ongoing reconciliation program is underway to rationalize the PVT data to use.
Additionally, we mentioned that the reservoir was gassier than expected. At the time of equipment design, the expectations were for a lower flowrate). Now, we have to account for the higher gas fraction. What impact does THAT have on FIV?
Base (Original) GOR: 0.427 GVF, 3.5 kg/s gas, 6.6 kg/s oil
Actual (Higher) GOR 0.768 GVF, 9.5 kg/s gas, 6.6 kg/s oil, +63% rho-V²
We can see that the FIV issue likely goes away completely for the original (lower) GOR assumption due to lower in-situ gas. And then we are not having this conversation. The additional gas increase on momentum - for the same oil flowrate - drives the FIV concerns. Given sufficient lead time, a decision could have potentially been taken to upsize the jumper, but hindsight is always 20/20. And, it would have led to additional engineering work to verify a new design, possibly delaying startup…
Field Data (Gauge Calibration)
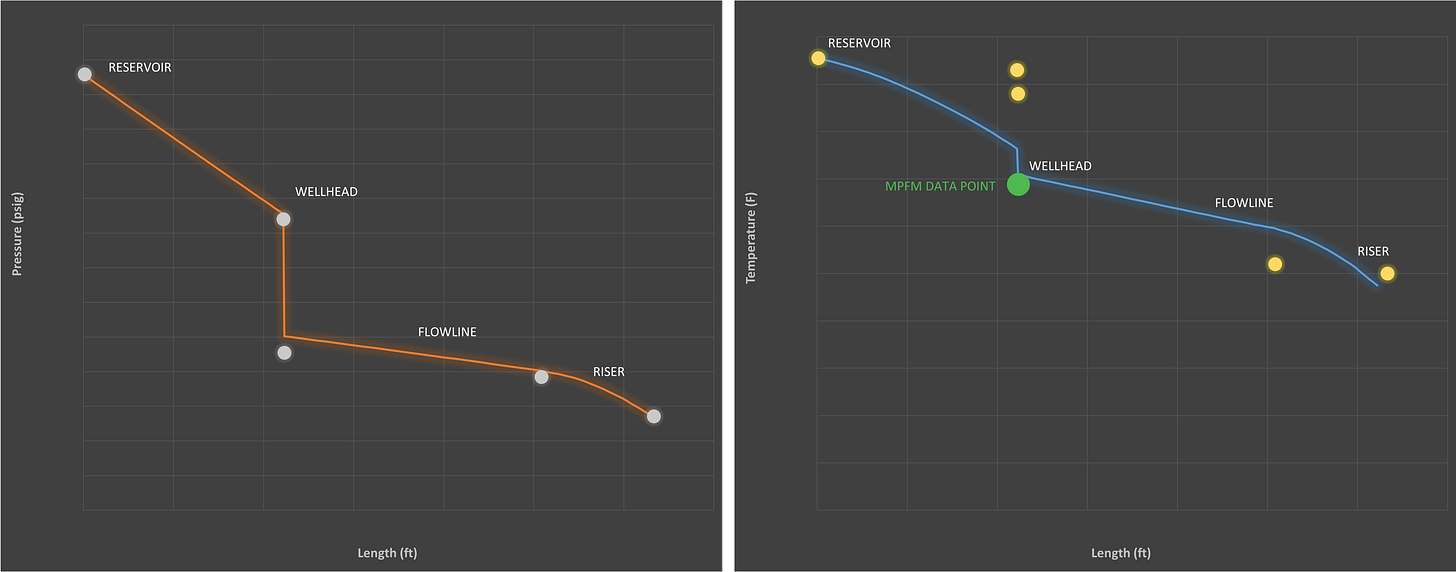
Speaking of meter calibration…one last ‘fun’ aspect of the startup was calibrating the thermal/hydraulic models against the field data once on-line. After taking a very panicked “Can you check if this is real??” phone call (and text….and email), we dove into a model validation exercise.
Good news - our pressure profiles “out of the box” matched pretty well. Not bad and some additional tuning easily brought these into balance. And, since our FIV criteria was largely tied to subsea pressure, confidence in the pressure measurement was key.
Bad news - our temperature profiles “out of the box” were terrible. Most concerning was the wellhead temperatures, which were much higher than anticipated - approaching (or exceeding) equipment design ratings! This prompted the anxious call, and for good reason. Ironically…our friendly MPFM meter - who we didn’t want to believe for the GVF - actually matched the model predictions pretty well.
A few sources of error were possible:
Simulation model is wrong (it happens…)
Wellhead temperature gauge is wrong (that also happens…)
Thermal insulation (flowline) has fallen off, leading to large dT in flowline that was not predicted in the model.
Ultimately - and through close collaboration with the subsea (I&C) teams - some errors in the temperature gauge were identified. The wellhead (tree) gauges was over-predicting temperature by a wide margin (+15°F). Identification of this was supported, in part, through the thermal modeling which highlighted the likely error.
During startup, before we have ‘hands on’ experience with the asset, we are heavily reliant on these gauges for remote surveillance. Development of “digital twins” - including very light ones such as simulation models - help to provide a robust monitoring back-up to assist through startup and beyond. They can fill in some data gaps, as well as troubleshoot when we see potential alarms.
Conclusion
Huh, yeah, let me introduce y'all…to the Wildside
Another start-up, another wild ride. Never event-free, but always a good way to learn and collaborate. The engagement with operations is critical to make sure we are tracking the right things, making those visible/accessible to the operators, and making sure that our engineering work is ‘practical’. Bridging that gap once again.
I tried to go through the whole post with only Good Vibration lyrics. But, to prove Marky Mark isn’t a one-hit wonder, I’ll liberally pull from the other song he and the Funky Bunch had, “Wildside”. I didn’t know he sang about ChemE’s, did you?
Cause deep inside Annie had aspirations…
Wanted to be a chemical engineer, Making fifty to fifty-five thousand a year…
This is how it is - on the Wildside


