Gas Starved Hydrates
When is plugging a real risk?
We return to what has become a favorite Pontem topic: risk-based hydrate management. This time, with testing and analysis support from one of our laboratory partners, SPL Flow Assurance Lab (Katy).
In a previous post, we discussed the minimum liquid hydrocarbon required to transport (LDHI-inhibited) hydrate slurries. We examined wet gas condensate systems (i.e., high GOR) scenarios where we could potentially convert 100% water phase into hydrates by introducing an excess gas phase to set the water volume as the limiting factor in terms of amount of hydrates we could form. You can read that post by following the link below:
This time, we are going to explore uninhibited low GOR systems, which is a bit like turning the previous study on its head: 100% available gas can be converted to hydrates while there remains free water. Questions we are hoping to answer include: do we find conditions where hydrate pluging is not observed, particularly in low water cut scenarios? Is there a magic GOR threshold in which we convert enough hydrates to result in a failure in tests? And, of course, how do we translate laboratory results to operational best practices to avoid costly remediations, while improving the asset OPEX profile?
The progression of risk-based hydrate management evolved from a position to chemically mitigate any operation with a potential for hydrates to form. A realization soon developed from observations that certain “non-plugging” crudes did not allow hydrate agglomeration to occur. In other words, hydrates may form, however they do not form plugs. If this non-plugging behavior could be demonstrated the mitigation requirements could be relaxed, effectively saving enormous OPEX costs in chemical savings. This evolution is continuing as engineers are looking at fields from a perspective of proper risk analysis: what is the likelihood of an event occurring and what are the impacts? My colleague, Conor Sherrard, posted on this recently:
Here, we will extend this to laboratory hydrate plugging tests using fluids we know will form hydrate plugs if left uninhibited under some conditions. Our question is to look at some production scenarios where hydrate plugging is not observed. First, we looked at low water cut scenarios based on the fact that some low water cuts will form stable emulsions with small water droplets. The idea that hydrate agglomeration will not occur is based on part of the working mechanism for how LDHI-AA chemistries work: effectively forming small hydrate particles that do not agglomerate. In the last example, we will explore a low GOR scenario’s hydrate plugging potential.
Visual
Many of our discussions on hydrates and testing methods have been more focused on rocking cells. Let’s be honest: there will be more interest generated if one is able to show cool, visual data while solving technical challenges! The rocking cell counterparts, HP autoclave and HP rheometers, offer additional controls in experimental methodology and data interpretation that is not available in rocking cell tests. The impressive visuals we get in rocking cell tests are replaced with graphic data. For this study, it is not critical to run low shear tests (rocking cells) to force the most conservative hydrate plugging conditions. We are more interested to have control over shear rates to investigate degrees of hydrate conversion and agglomeration. Autoclaves and rheometers offer torque data, which is a highly sensitive dataset for evaluating hydrate formation onset, initial degrees of agglomeration, and plug formation. This sensitivity is important for this study especially because we will be making small increments in water cuts, and it is important to be able to differentiate these subtle changes.

Proof of Concept
In our first example, we explored the minimum water cut for hydrate plugging potential of uninhibited fluids using autoclave testing. The field was a mid API (20-30), asphaltenic, sweet crude with modest salinity (<40,000 TDS) brine. The field had operated without LDHI prior to water breakthrough, although an LDHI was qualified for shut-in and restarts. The study was intended to answer the question: is there a water cut threshold below which LDHI is not needed?
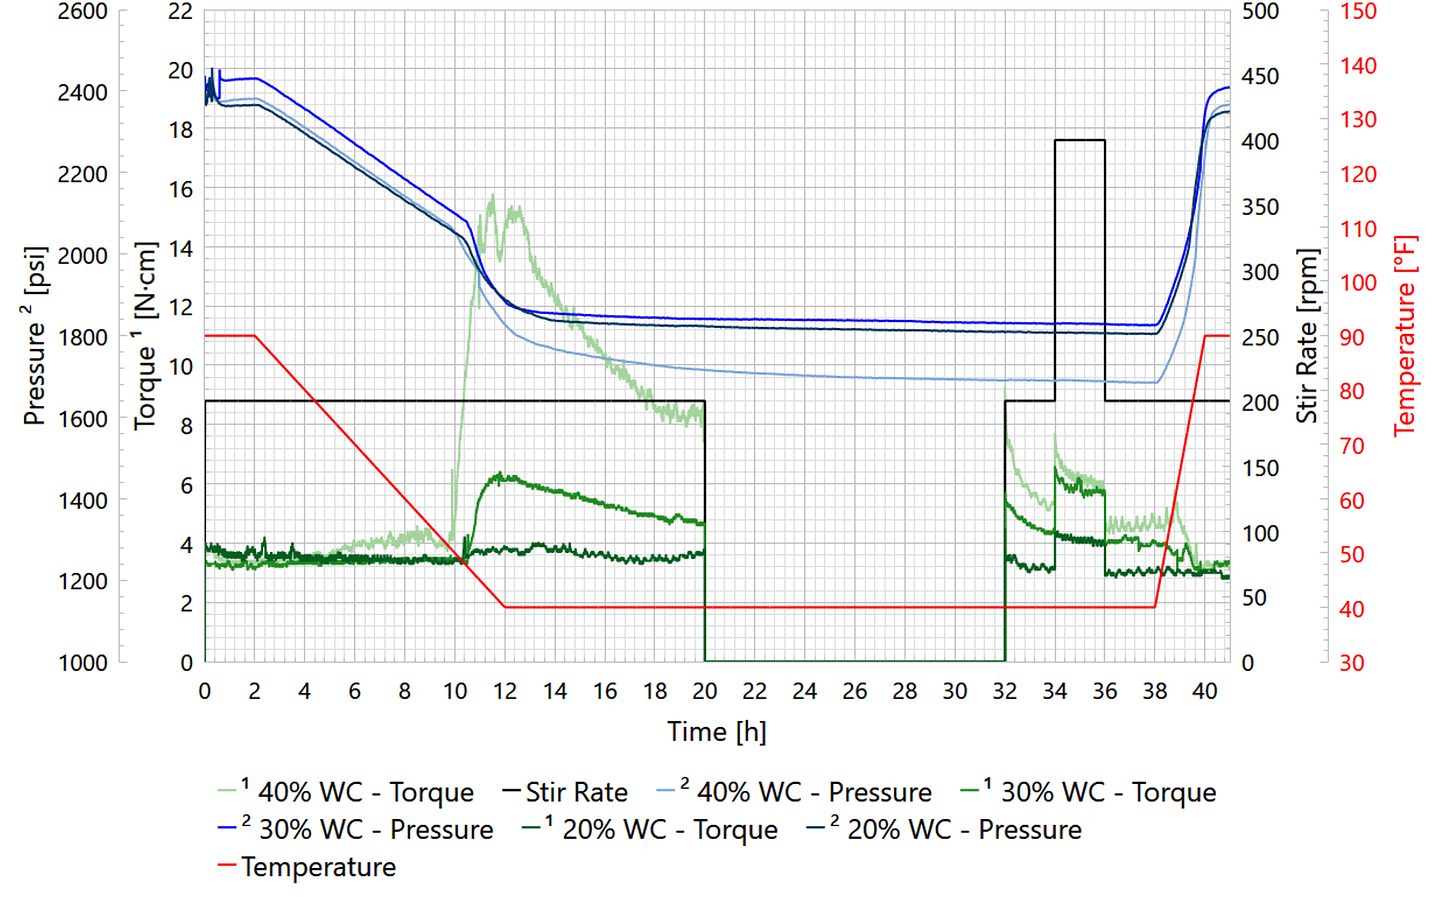
The summary graph of the autoclave tests below shows torque (green) and pressure (blue) responses. The water cuts for the tests range 20 - 40 vol% while the GOR for the test conditions was 2,500scf/bbl. Hydrate formation is noted in the tests as the temperature (red) continues to cool below 50°F (10°C) by noting when the pressure change deviates from linearity with respect to temperature change. The sudden drop in pressure is a common phenomenon for hydrate formation onset during constant volume hydrate tests. Two of the test torque responses show increases along with hydrate formation (t = 10 hr). Following a shut-in and restart (noted in the black stir rate at 0 rpm) the fluids for 40% and 30% water cuts display higher torque at the onset of mixing compared to the shut-in values, while the 20% water cut scenario does not, indicating a significant hydrate agglomeration has not formed. To steal from Goldilocks,
40% water cuts show too high torque and will likely lead to plugging events
30% water cuts show medium torque responses and the likelihood of hydrate plugging is probably less, the risk is high enough to warrant mitigation strategies
20% water cuts show low torque responses and the likelihood of hydrate plugging is low.

These laboratory results were used to develop a hydrate mitigation strategy for hydrate inhibitor chemical injection to begin for shut-in and restarts when water cuts reached 25%. The field continued to operate without LDHI until water cuts reached the 25% threshold, after which LDHI injection has been successfully utilized for hydrate control for transient operations.
New Field Start-Up And Hydrates
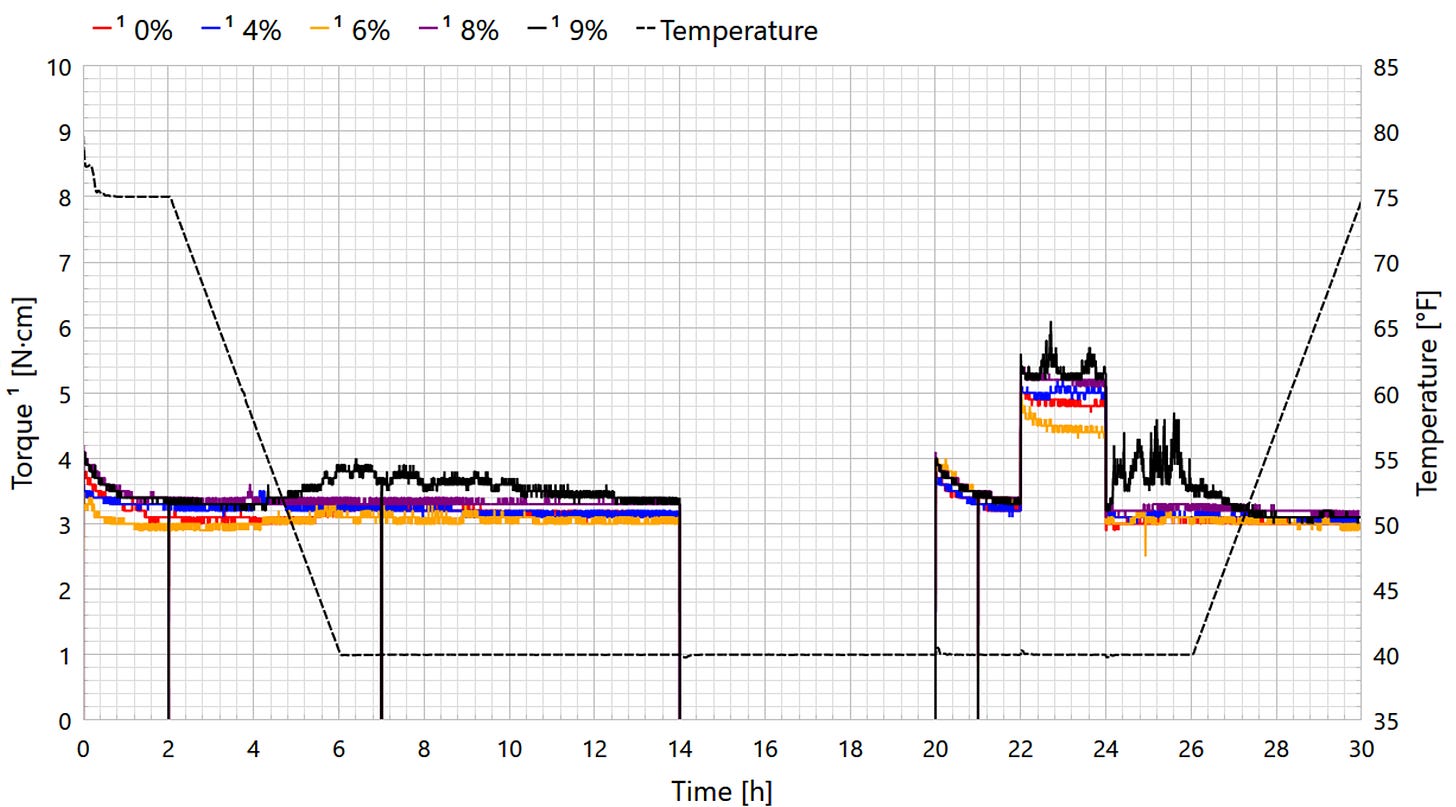
For our second example, operators were interested in setting a water cut threshold in which LDHI application would be delayed until after water breakthrough. As opposed to the first example, this field was expected to see water breakthrough quickly and the engineers wanted to examine water cuts in smaller increments. Interestingly, the limit by which hydrate agglomeration occurred was much lower, shown below: 9%! While the torque responses are subtle, clear increase in erratic toque response is noted as soon as the temperature decreases below 50°F (10°C) for the 9% water cut. A conservative recommendation was made to begin LDHI injection after water cuts exceeded 5%, which calculated to a potential $1 MM OPEX savings in chemical costs based on estimated water breakthrough timelines.

The main takeaways from these two cases are:
It is possible to develop a risk-based approach where LDHI (or other chemical mitigation) does not need to be injected immediately at start-up. Laboratory tests aligned with field behavior, validating methodology to discern hydrate plugging risk as a function of water cut.
One size does not fit all, and it is important to carefully examine the field conditions to determine when hydrate plugging becomes likely (and not just possible!). Case 1 did not require chemical mitigation until 25% WC, whereas Case 2 required LDHI in water cuts exceeding 5%!
Test Design For A Low GOR System
The two examples above show the sensitivity, in general, of hydrate plugging potential when changes to water cut are examined. A low GOR system requires a method with increased sensitivity due to the potential for lower hydrate volumes compared to “standard” hydrate HP rheometer tests. To address this, a more complicated mixing protocol was employed, shown in the schematic below. The two main changes to the set-up include:
Two stir rate cycles with multiple step-up / step-down stages before and after shut-in. This is important to discern subtle changes in viscosity and by repeating this cycle before and after a shut-in any changes in hydrate agglomeration should be detected.
A gradual restart over a 1-hr time period after the shut-in. The short-but-gradual ramp-up in stirring allows for yield stress measurements to be made. By checking for any hysteresis the hydrate plugging can more closely be addressed.
20% Water Cut
The initial 20% water cut was conducted using ~700 scf/bbl GOR. While a full cell plug was not observed, less than half of the water was converted to hydrates resulting in significant agglomeration. This can be seen at hydrate onset (~9 hrs) by the sudden spike in torque (green trace). Additionally, the spike observed during the warm-up phase at t = 42 hr indicates hydrate agglomerates had deposited on the cell wall and sloughed off during the warming period. Similar to the Goldilocks example, the 20% WC elicits torque responses too high to consider operating without a continuous chemical injection to control hydrates.

Lower GOR
The question we asked was could we lower the water cut and observe a non-plugging trend. The water cut was reduced to 10% and two GORs were tested: 600 and 400.
The graphic below overlays the tests’ torque and pressure data for comparison. Interestingly, the torque for the lower water cuts were higher in magnitude than the 20% water cut case. Both scenarios show a low hydrate volume (<5%) and there have been some statements made that hydrate plugging can not occur below a 5% threshold. While this rule of thumb may be valid for some scenarios, a concerning trend was the increased agglomeration trend observed in both cases. The 390 GOR showed a large spike in torque at restart (t = 31 hr), while the 585 GOR test showed increased torque response in the restart stir cycle compared to the cycle prior to shut-in. The risk of a plugging event during an unplanned shut-in was too high to consider the 10% low GOR cases for uninhibited production conditions.
While the GOR was decreased, the torque response was similar between the two 10% WC cases: a full hydrate plug was not observed, however hydrates are not dispersed enough to prevent significant agglomeration. Because hydrates can freely agglomerate, in a flow line where there is a continuous feed of water and/or hydrates the risk to eventually plug is high.
5% Water Cut
The purpose of continuing further down in water cut is to address whether the system would come online with LDHI deployed or if start-up could proceed with methanol followed by turning off methanol after the well had warmed the system and all drilling fluids had been cleaned out. Additionally, if the trends from the previous tests continued, we were hoping for lower hydrate volumes and good restart behavior.
The 5% WC data shown below shows hydrates form upon reaching set point (t = 8 hr). There are two spikes in torque between t = 17-18 hr and a small spike during warm-up indicating hydrates on the cell wall. The hydrate volume is low (2.2 vol%) and the conversion of free water is ~40%. The torque response remains low throughout the test and the response to stir rate changes is appropriate.
While there are encouraging signs to suggest there isn’t enough agglomeration to form a plugging event, the torque data is far from perfect and concerns are evident.
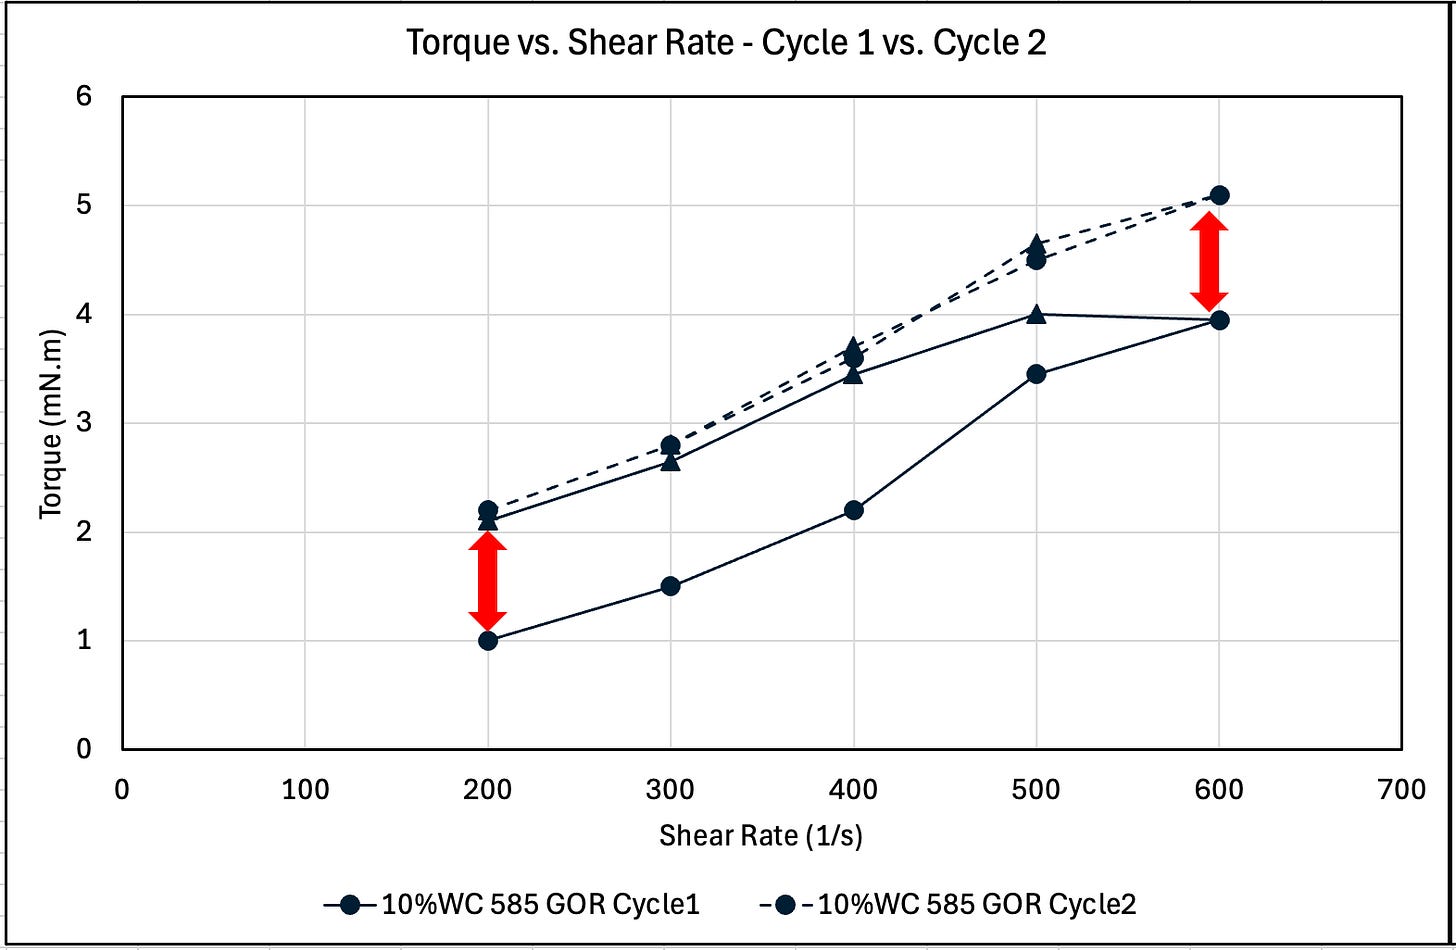
To further look at the torque response changes, we plotted torque vs. shear rate differentiating each cycle. In the 585 GOR/10% WC case, cycle 1 diverges in cycle 1, as the shear rate is brought up to 600 1/s and then returned to 200 1/s. The return cycle is indicated by triangles and the higher torque suggests hydrate agglomerates are causing the higher strain on mixing the fluids. And we see in cycle 2 (dashed lines) the continued rise in torque response suggesting hydrates are beginning to bed and settle.

We note some subtle changes in fluid behavior when decreasing the GOR to 390. Cycle 1 does not deviate as the shear rate ramps back down, suggesting minimal fluid change. There is a small increase noted (triangles above circles) possibly caused by the formation of a tighter emulsion, which will increase fluid viscosity. However, the overall drop in cycle 2 torque indicates fluids have been trapped by hydrates pushed against the wall. As less fluids are available to contact the mixer the overall torque is less. This trend is indicative of hydrate deposition and should not be considered for uninhibited operations.

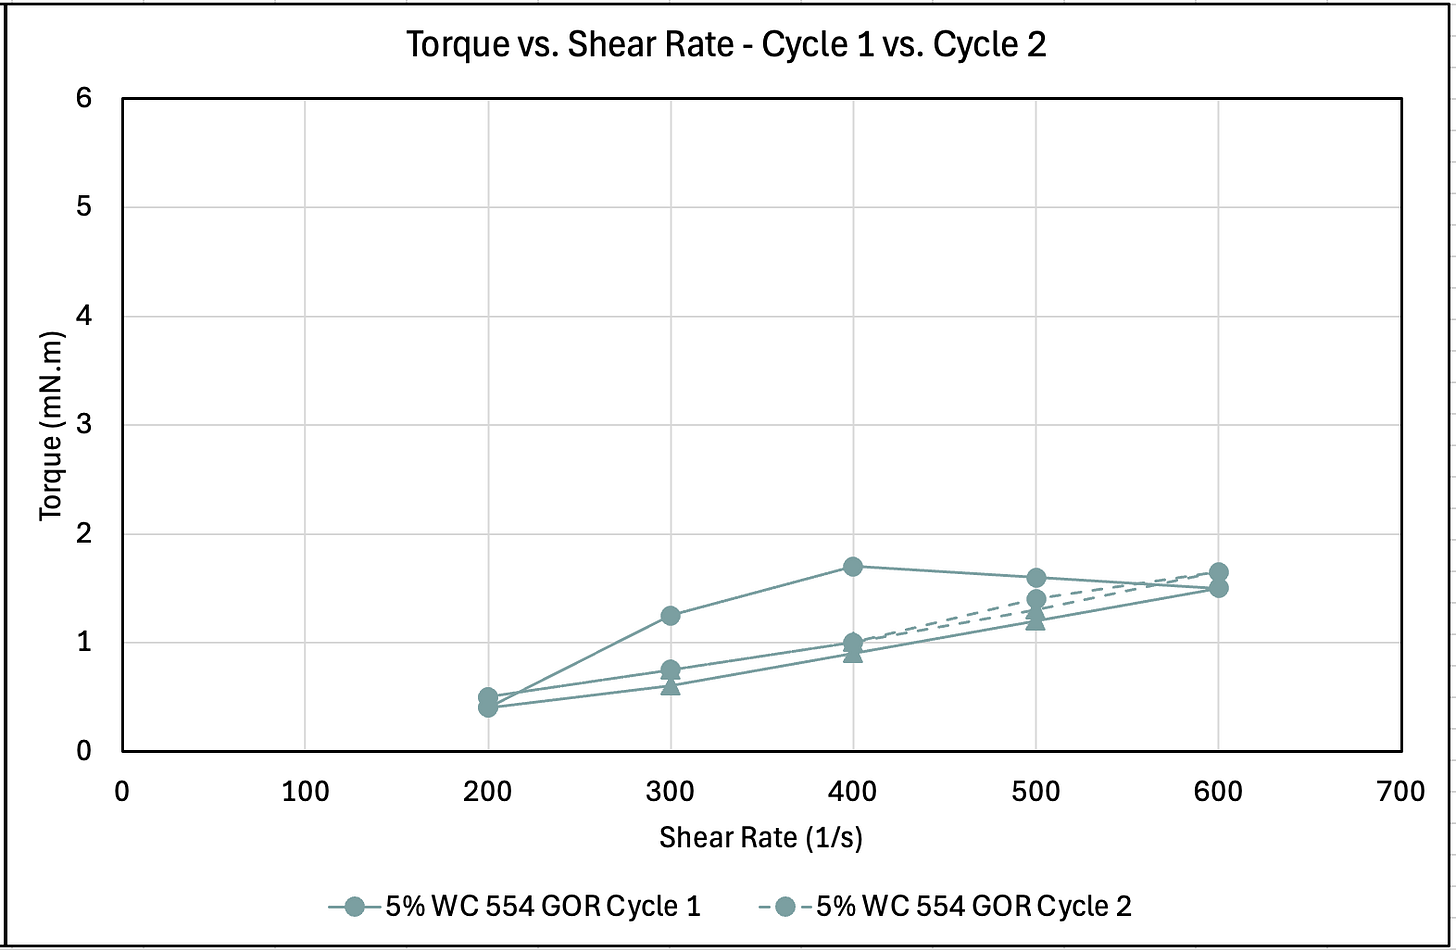
The 5% WC fluid behavior is different than either of the 10% WC cases. The two most obvious facts are all starting and stopping points in the cycle (at 200 1/s) converge to the same torque reading. Second, the two cycles are within the same torque range, indicating there are no changes during the shut-in and restart. Hydrate crystal growth and agglomeration is not occurring during the transient phase.
Cycle 1 shows hysteresis with the ramp up (solid line circles) registering higher torque than the ramp down (solid line triangles), which indicates some hydrate bedding is occurring. However this appears to be minimal due to the fact there is convergence at the end. Cycle 2 (dashed lines) does not show any hysteresis and the torque responses are very close to the ramp down readings in cycle 1. This can be interpreted as no significant changes in the fluids have occurred during the shut down/restart. In other words, there is not a continued growth of the hydrate network. And with no hysteresis occurring the second phase of mixing does not induce further hydrate formation.

On the basis of the fluids behavior, it is estimated hydrate formation does occur, however there is not a significant agglomeration process and plug formation with such low water volumes is not likely.
Take Away Messages
The three examples provided showed three very different behaviors for hydrate plugging tendencies. While running simulations is important to understand when the system will be operating in the hydrate region, it is equally important to understand the risks operations is willing to take and to understand how big those risks are under the various operating scenarios. From there, testing fluids for hydrate formation AND hydrate plugging is critical to developing the risk tolerance.
We have more cutting edge hydrate research projects ongoing, and are looking forward to sharing those in the near future. Be sure to continue to tune in to hear about these exciting stories. And if there are hydrate concerns you’re working on, we’d love to hear about them!


