
Advanced Hydrate Testing
Case Study: Dead Oil Displacement / GOR differentiation risk


Formation vs Blockage - Is There a Difference?
We continue our exploration of risk-based hydrate management strategies with collaborations with facilities such as Kernow Analytical Technology (KAT), SPL, Oilfield Technologies, and Instituto Mexicano del Petroleo (IMP). We’ll highlight the visual and quantitative data used to interpret the hydrate plugging risk.
Let’s start with the extreme: zero risk. Here, any possibility of hydrate plugging must be engineered out, so fully avoiding hydrate formation is the only way to prevent a hydrate blockage (i.e., hydrate mitigation strategies). Zero risk strategies can quickly become costly, and overly burdensome to the point of eliminating development concepts altogether.
Without being overly simplistic, if we start looking at non-zero risk strategies we want to differentiate the potential for a hydrate blockage. Accordingly, we will need to examine scenarios where hydrates form, yet no blockages are observed.
Hydrate Curves - So You’re Sayin’ There’s A Chance…
Hydrate curves depict the thermodynamic stability of hydrates under various pressures and temperatures. Outside the curve (to the right, green shade) hydrates are not thermodynamically stable and will not form. On the other hand, the pressure/temperature combinations inside the curve (to the left, red shade) are conditions where water and small hydrocarbons will structurally orient themselves in a more energetically favorable condition to form a clathrate hydrate structure. Laboratory tests can lead to two different hydrate curves depending on the chosen experimental protocol, namely, a hydrate formation curve, or a hydrate dissociation curve. In other words, one might find different hydrate equilibrium conditions when cooling down vs. heating up a system. This hysteresis phenomenon occurs, in part, due to the stochastic nature of hydrate nucleation. Visually, we can differentiate three regions in a pressure vs temperature diagram: hydrate stable, hydrate free, and a metastable region (orange shade). What does this have to do with risk?

Hydrate formation has a negative Gibbs free energy, which means it is an exothermic reaction. Hydrate dissociation has a positive Gibbs free energy, which means it is an endothermic reaction. Practically speaking, as the system cools (move isobarically right to left) and just crosses the dissociation curve (solid curve), hydrates are thermodynamically stable, so hydrates COULD form. In actuality, they will begin to form leading to an exotherm, which adds heat (locally), dissociating the hydrate and pushing the system back to the right over the line. Cool the system enough (shift all the way to the formation curve, dashed line) and there is not enough exotherm to dissociate the hydrates, so they remain stable. The point here is that the thermodynamic phenomena described creates a Metastable Region where things could go south if ignored, however there are operational best practices available to manage a hydrate plugging risk and avoid the upset.
This “metastable” phenomenon was noted in 2015 by Lachance et al., (International Petroleum Technology Conference, IPTC-18432-MS), where they reported hydrate formation in flow loop tests are typically observed when subcooling temperatures range 2°F - 6°F. In the figure below, a spike in temperature is noted due to the exotherm observed during hydrate formation.

The industry has utilized the more conservative dissociation curve, which builds in a few degrees safety factor compared to the association curve, while remaining thermodynamically consistent and predictable. Whereas hydrate formation is not only thermodynamically-driven, but also based on the kinetics of the system. This makes it a stochastic process, which means it has a random pattern that may be analyzed statistically, but may not be predicted precisely. A risk-based approach will recognize and account for a system that operates within a thermodynamically high-risk region (to the left of the metastable region) to factor in how likely hydrates will form or quickly a plug will develop. So, the question becomes how can we test the likelihood of a hydrate stable system to form a plug? We’ll go through three examples that highlight different aspects of hydrate formation vs hydrate plugging.
Cooldown Times
In many systems, we design the operation to safe-out the system during any upset conditions (planned maintenance, hurricane evacuation, emergency shut-in, etc.) such that we remove any hydrate formation risk. “Standing Instructions” can layout when to start certain safe-out operations.

These times identify when certain operations need to be started/completed, which impact downtime, chemical usage, and thermal requirements (i.e. insulation). In the case above, the system needs to retain enough heat to stay “warm” for ~13 hours. This comes at a cost (CAPEX, for insulation and the installation of the system, as well as OPEX, for when curtailment needs to start). The longer we can wait, the more production we get as we may even avoid initiating a full system preservation operation (i.e. repairs completed in time, weather changes, etc.) So, the question is whether we must pay for this insurance up-front OR whether we can be more aggressive with the timings.
Visual Observation of Fluid Displacement
In a collaborative study with the Instituto Mexicano Del Petroleo (IMP), we designed visual tests to evaluate hydrate plugging risk during dead oil displacement. Laboratory scale testing of this unique transient operation has not been widely published due to equipment capability limitations (autoclaves/rocking cells) or massive fluid requirements (flow loops).
Dead oil circulation (DoC) is a hydrate risk mitigation strategy for long-term shutdowns, cold restarts, and subsea production system preservation for long dead legs. In the latter, subsea flowlines are filled with “dead” oil, which is actually degassed oil, prior to isolation and cooling to ambient temperatures. During DoC operations in systems containing dead legs, warm production fluids might suddenly mix with the cold, dead oil in the dead legs as it is displaced from the previously isolated section. Hydrate plugging risks arise under these scenarios when transient temperatures create thermodynamically favorable conditions for hydrates to form.
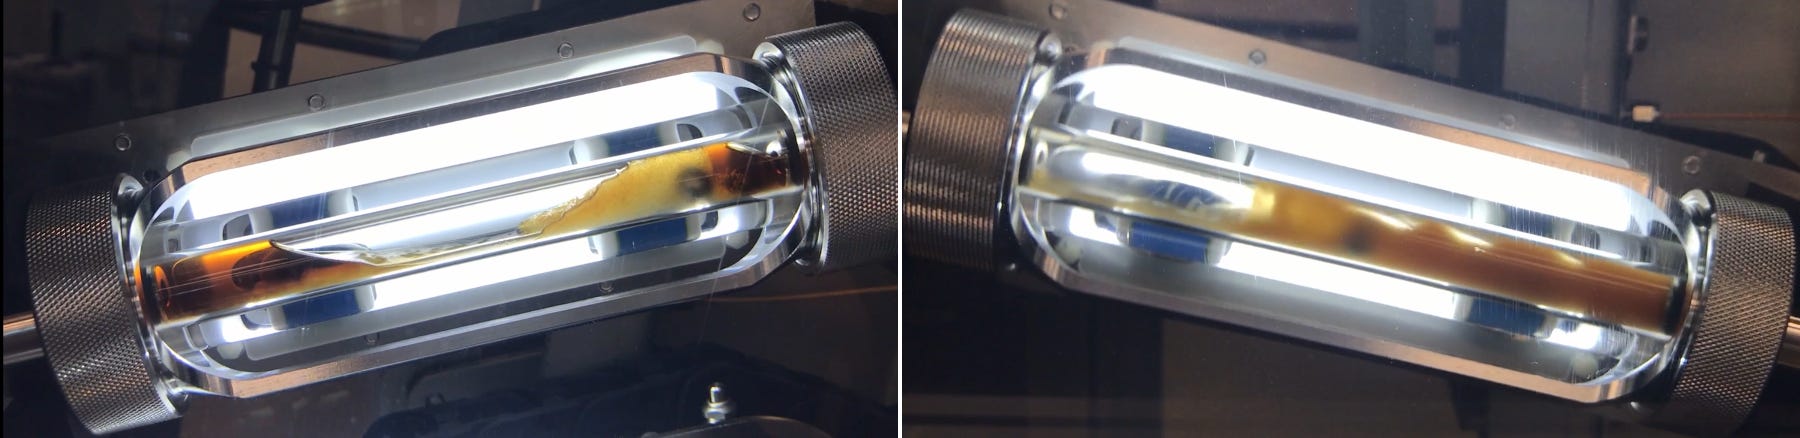
Using a state-of-the-art visual cell capable of fluid displacement under high pressure conditions, we designed proof-of-concept tests to subject oil/water/gas fluids to hydrate forming conditions under shut-in scenarios and visualize the displacement of the live fluids in the cell with cold dead oil. The conditions include structure II (sII) hydrate forming gas composition with a GOR of 1,000 scf/stb and 60 vol% water cut.
The video below is a compilation of still images taken throughout the test. Notable time marks to pay particular attention to include:
0:00 - 0:22 - fluid loading into the cell via piston movement and mixing.
0:22 - 1:11 - Shut-in and cooldown. Hydrate formation is visually observed in the aqueous phase at 0:24, extending along the liquid hydrocarbon / water interface. Hydrates continue to form in the hydrocarbon phase and oil/gas interface.
1:11 - 1:24 - crude oil is injected from the bottom of the cell with mixing. The gas phase is displaced by 1:13 and the mixing disrupts the intricate hydrate shells. A visible liquid phase is noted rising to the top by 1:18 and fluids remain mixing through the duration of the test. As the free gas phase is displaced additional hydrate formation is not visibly noted, however clear, mobile hydrate particles are noted.
In addition to the visual data, changes in pressure drop (dP) across the cell were monitored during the dead oil displacement and shown in the chart below. In this stage of development, we examined differences between mixing rate and dead oil injection rate during the fluids displacement. The pressure drop profile is dependent on both the mixing and the displacement rates. As displacement rates are increased from 0.5 cc/min to 10 cc/min the pressure drop increases. In the graph below, time 0.00 represents the start of deal oil displacement into the cell (1:11 in the video above). The lowest displacement rate (0.5 cc/min, 750 rpm, blue line) shows very low pressure build-up overall and no pressure spike at the onset of displacement. These results indicate the hydrate network was porous enough to allow fluids to be displaced, and there were not indications of further hydrate formation (visually or via pressure data). Conversely, the highest flow rate (10 cc/min, 750 rpm, red line) showed a large spike initially, a pressure drop, and finally a rise in pressure leveling out to > 60 psi.
The dP spike and subsequent rise in pressure is attributed to the high rate of fluid displacement vs the high stirring, as the comparative test using 10 cc/min and 350 rpm produced a very similar profile compared to the first 10 cc/min and 750 rpm test.
The black line represents relatively moderate displacement conditions using 5 cc/min and 500 rpm, and the subsequent dP data is between the two initial experiments. First, there is not a spike in dP at the onset of fluid displacement. Second, the gradual rise in dP over time is slower and asymptotes near the midpoint.
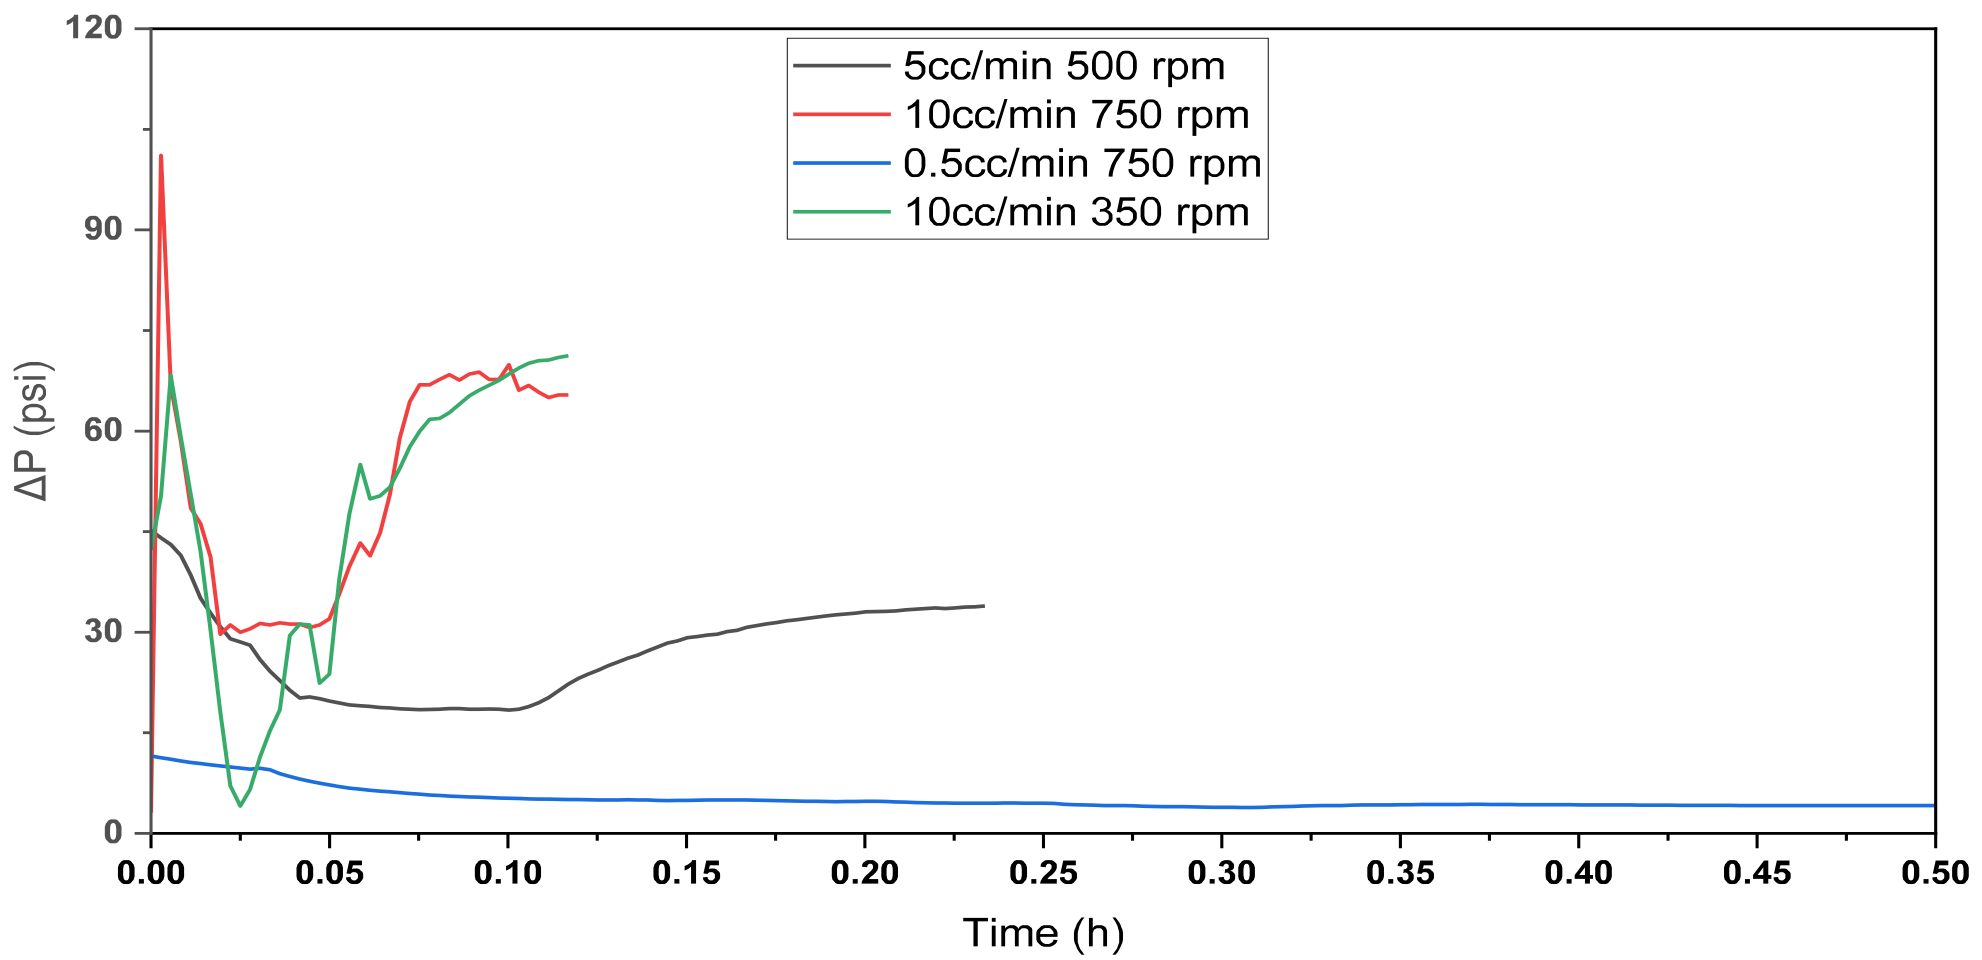
Importantly, we did not observe plugging during the displacement period despite clearly observing hydrates having formed.
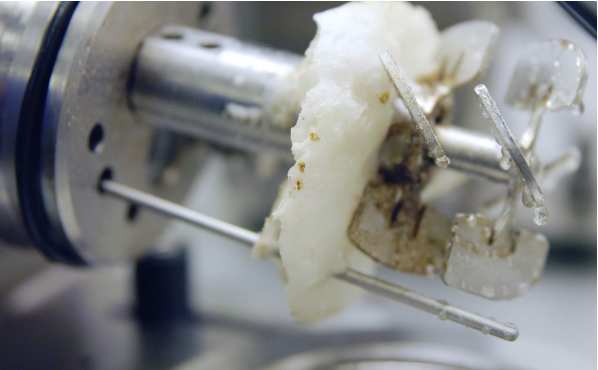
In the first round of screening, we focused on 60% water cut conditions and three GOR’s: 250, 500, and 1000 (see hydrate collage below). Visually, as GOR increases there appears to be more hydrate formation occurring. While not confirmed with gas uptake, it appears the hydrate network is more rigid / solid at the higher GOR conditions. The deal oil displacement step also appears to confirm this, as well. The thin shell in the 250 GOR case is broken open in the middle and second liquid phase bubbles are noted in the top phase. There is a lot of turbulence noted in the 500 GOR test, presumably due to the stronger hydrate network and smaller liquid channels available, creating more force during displacement. Finally, the 1000 GOR case has enough hydrate mass to remain in tact that the oil pushes the hydrate agglomerate to the top of the cell.

These tests present preliminary results and are meant to represent worst-case scenarios where fluids had remained shut-in beyond a designated no-touch time and hydrates had actually started to form. We are continuing to investigate other conditions, including GOR, water cut limits, and no-touch time variables. Stay tuned for more updates on this exciting project!
Torque Response For Hydrate Plugging Potential
As part of the displacement study, the transient nature of this operation present conditions such as a very fast cooling stage (less than 30 minutes) follow by a slow warm-up with duration of up to 6 hours before reaching unfavorable hydrate forming conditions. Based on these parameters, modified HP autoclave tests were designed to evaluate plugging risk under temporary conditions. The challenged was expanded to examine how plugging risks may change over the life of the field. To cover several production phases 3 subcoolings, 2 water cuts, and 4 GORs were selected. Torque was used as the principle tool to score hydrate plugging risk, as it indirectly indicates hydrate agglomeration tendency and full plug formation in a worst case scenario. Gradual increases in torque can indicate an increase in fluid viscosity, which could indicate effective flowing behavior of a hydrate slurry. Conversely, sudden and erratic increases in torque are indicative of large hydrate agglomerates and plugging tendencies of hydrates.
In a collaboration with the legacy AFS (now SPL) flow assurance lab, we carried out more detailed work on GOR impacts. The figure below illustrates a matrix summary comparing water cut, maximum hydrate sub cooling, and GOR. In the low sub cooling conditions (10°F), the unresponsive torque data indicates hydrates do not form in the relatively short duration of the test. This was confirmed by evaluating the pressure data (not shown here). The thermodynamic driving force under these conditions is not strong enough to force hydrates to form within the given time, and therefore low subcooling conditions are a low hydrate plugging risk during transient, dead oil circulation scenarios.
As conditions for hydrate formation become more favorable via increased subcooling and higher GOR, water cut impact is noticeable. Torque data in the low water cut scenarios (top, middle box) are gradual and relatively smooth; indicating smaller, well-dispersed hydrates. At moderate subcooling and low water cuts, hydrate plugging remains relatively low. Increasing the water cut results in sudden and erratic torque behavior (bottom, middle box), which is indicative of non-uniform hydrate dispersion and larger hydrate agglomerates. When water cuts are increased, the hydrate plugging risks increase from low to moderate.
Finally, high subcooling conditions (30°F) (right, top/bottom boxes) showed the highest torque with the most erratic patterns, indicating a high risk for hydrate plugging to occur.

What Does it All Mean?
What do these results mean from a risk matrix perspective? In early field life, where water cuts and GOR are relatively low, a low hydrate plugging risk is expected for dead oil operations. As water cuts and GOR increase over the life of the field, so does the hydrate plugging risk for dead oil operations. Additional safeguards are recommended as the field ages, such as including injecting a thermodynamic inhibitor in front of any dead oil being pumped, or beginning the start of the dead oiling operation earlier in the shutdown sequence to take advantage of the higher temperatures of the live fluids. A visual hydrate plugging risk matrix is shown below, based on the hydrate autoclave test results.

Visual Confirmation of Plugging
In our final example, we return to a previously-discussed case study where we relied on visual observations to tell whether fluids remain mobile vs fully plugging the test cell. We won’t rehash the details, so click the link to check out our exploration of high GLR systems in rocking cells. We were interested in two questions: could we differentiate hydrate blockage risk in low liquid loading systems and could LDHI’s work under low liquid loading conditions. We collaborated with our friends at KAT, utilizing their rocking cells for this project.

The three images below highlight increasing liquid loading in a rocking cell, ranging 50 vol% down to 10 vol%. While there is not an official standard set of conditions to use with rocking cells, a general consensus is to run tests at a 50% liquid loading level. There is enough fluids to clearly differentiate passes and failures, and there is enough gas to theoretically convert 100% of the water into hydrates. Depending on fluids, pressures, water cuts, etc. test cells have a rough GOR of ~ 2,500 (scf/bbl) for a 40% water cut system. All tests were dosed with an LDHI. In the image on the left, we observed mobile fluids without a hydrate blockage, establishing a baseline for LDHI performance at “standard” conditions. Notice the turbulence created just after the ball impacts the mobile fluids as gravity moves the ball left to right.

We followed this up by decreasing the liquid loading to 30%. While we have increased the GOR all other conditions were kept constant. The middle image clearly shows a hydrate blockage. Solids are noted throughout the cell, and most of the fluids are in the upper half of the cell with the ball immobilized.
In the final image on the right, the liquid loading was further reduced to 10 vol% observing again characteristics of a hydrate plug. There is not a mobile phase present, yet large hydrate plugs are formed at each end of the cell, as well as along the length of the bottom of the cell. Surprisingly, the ball was lodged in the left corner. Prior to running this test, there was a legitimate question whether there would be enough fluid volume for a hydrate to block the movement of the ball. While the result was disappointing from the perspective of observing a “pass” using a chemical solution, the tests confirmed very low fluid volumes in a rocking cell could form a blockage. Ultimately, the testing parameters envelop has been expanded and new production scenarios can be evaluated on a risk-based approach for hydrate mitigation strategies.
Wrapping Up
We have discussed three unique methods and conditions to evaluate plugging potential while in the hydrate region, and its relevance within O&G field operations. We’re also continuing to push the envelope on designing laboratory tests to closely model and de-risk transient operations in the field. The results shared here continue to highlight production conditions do have viable pathways to operations without exposing the system to unacceptable risks.
We still feel it is important to carefully review the typical start-up, steady-state, shut-in, restart strategies. The industry has a solid handle on how to successfully manage most of these situations and trust-but-verify qualification laboratory work should continue to be best practice.
With that said, we are expanding the unique operating scenarios that can be tested and putting them under the microscope, as well as working to align laboratory results with field operations to answer key questions centered around whether hydrate formation conditions will lead to actual plugging events, or whether safe, best-practice operations can be developed to avoid overly-costly restrictions.