What’s the Optimal Car Rider Pickup Time
A Data-Driven Approach to Parenting

Background
My wife and I are deep in the “pickup and drop-off” days of parenting (IYKYK). The big one each day is the afternoon pickup. We’re lucky to have grandma help several days a week, but when it falls to me or my wife, there’s one big decision:
What time should you arrive for pickup?
My wife’s answer:
“Get there 30 minutes early and be one of the first to get our daughter.”
My answer:
“Get there closer to actual pickup so I minimize the time commitment.”
Now, I really don’t want my daughter to be the last one picked up (too many days in a row of that and you start getting looks from the teachers). But I’m also generally very busy and want to avoid a big break in my afternoon if I can.
After enough firsthand pickup-line experiences at my daughter’s school, I’ve built a decent intuition for how to minimize my wait and that’s how I came to my answer above. But the data scientist in me is curious to try and prove it with statistical simulation and modeling.
Simulation Approach and Key Assumptions
To try and settle this, I wanted to build a model of the pickup process that enables me to simulate thousands of pickup days and see what happens on average. Below are some of the details of the model as well as its key assumptions.
The Model
What I’m looking to model would be classified as a discrete-event simulation. Within that, the pickup queue is modeled as an M/G/k queue (a common type of queue process):
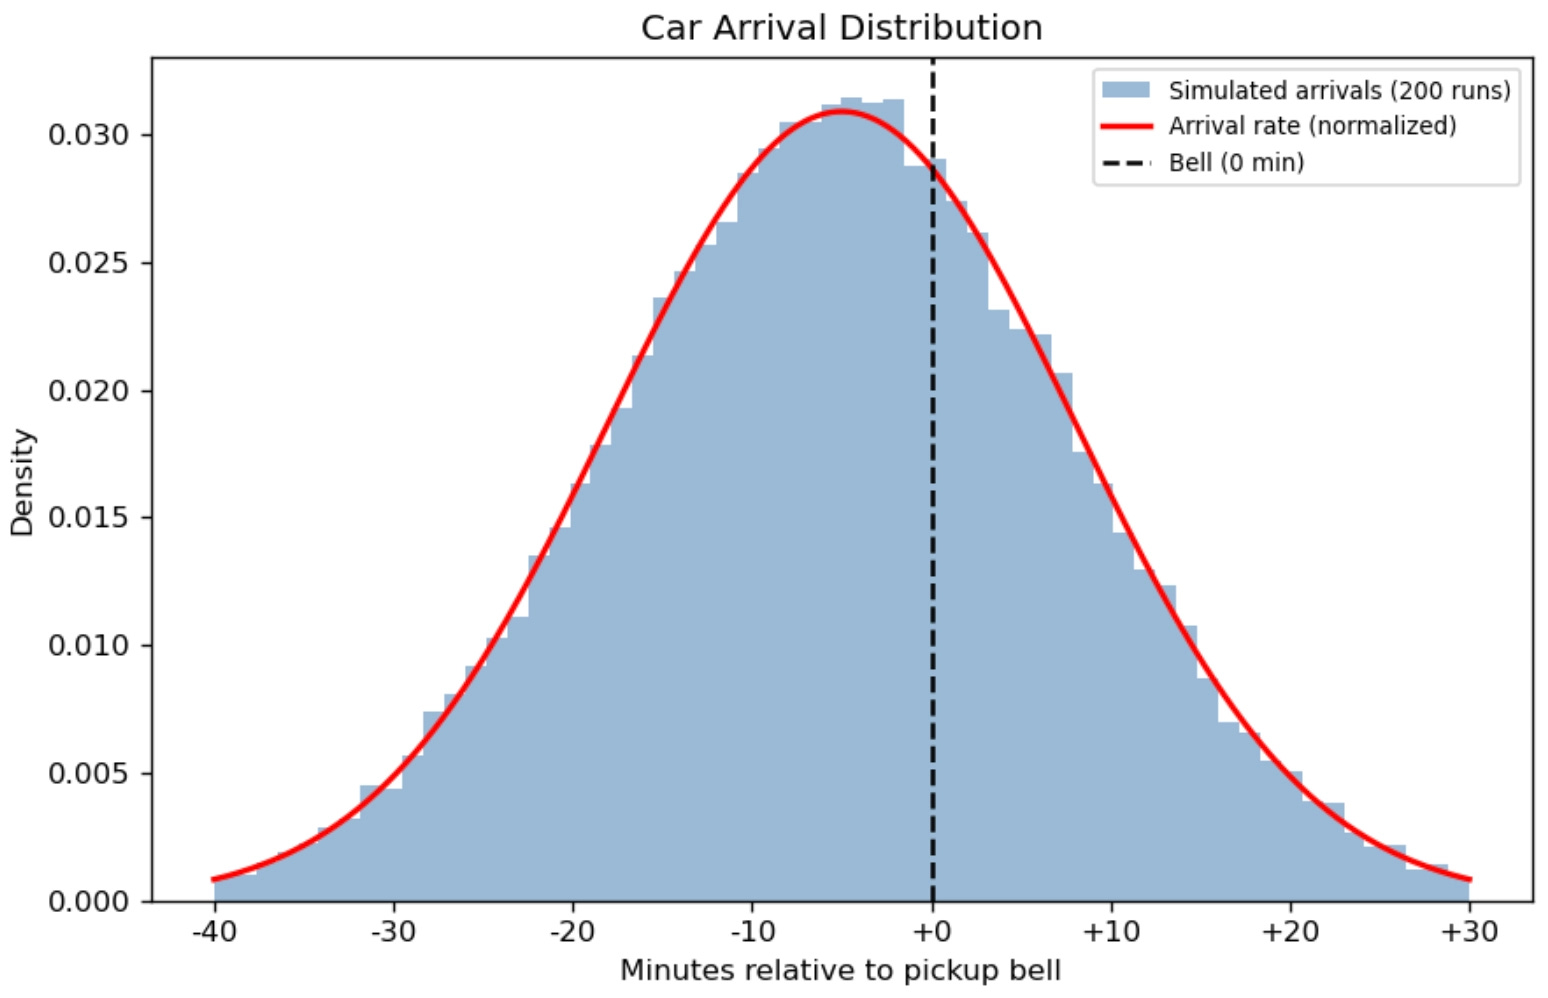
Cars arrive randomly following a non-homogeneous Poisson process — meaning they don’t all show up at once, but cluster around the bell in a bell-shaped pattern (no pun intended). The peak arrival rate actually hits about 5 minutes before the official pickup time.
Service times are random too meaning how long each car takes to pull up, load a kid, and pull away follows a log-normal distribution (most cars are quick, but every now and then someone needs to track down a missing lunchbox, I’ve even seen a shoe fall off).
Multiple loading spots operate in parallel meaning just like the real curb, several cars can load at the same time in a first-in, first-out order.
I then ran 3,000 Monte Carlo simulations — each one representing a full school day — to build up a statistical picture of wait times across every possible arrival time.
Key Assumptions
~240 cars arrive per pickup session (roughly 60 kids per grade after accounting for after school activities for some of them × 4 grades)
4 parallel loading spots at the curb
Average service time of 30 seconds per car with a standard deviation of 15 seconds, including pull-up, load, and pull-away (our school seems pretty efficient)
Arrival peak is 5 minutes before the bell, with ~68% of all cars arriving within ±13 minutes of that peak
The simulation window spans from 40 minutes before to 30 minutes after the bell (picking your kid up 30 minutes after the bell would be pretty bad)
Cars are served first-come, first-served — no cutting, no VIP lane for parents who “just need to grab one kid real quick”
Each simulation day is independent — no memory of yesterday’s chaos
Results
We’ll start first with car arrival distribution which shows when most cars tend to arrive. A quick sense check confirms this is reasonable. Most parents tend to arrive before the bell gets out, which is why we see the peak before +0. Having said that, there are still some arrivals after the bell gets out too (like me).
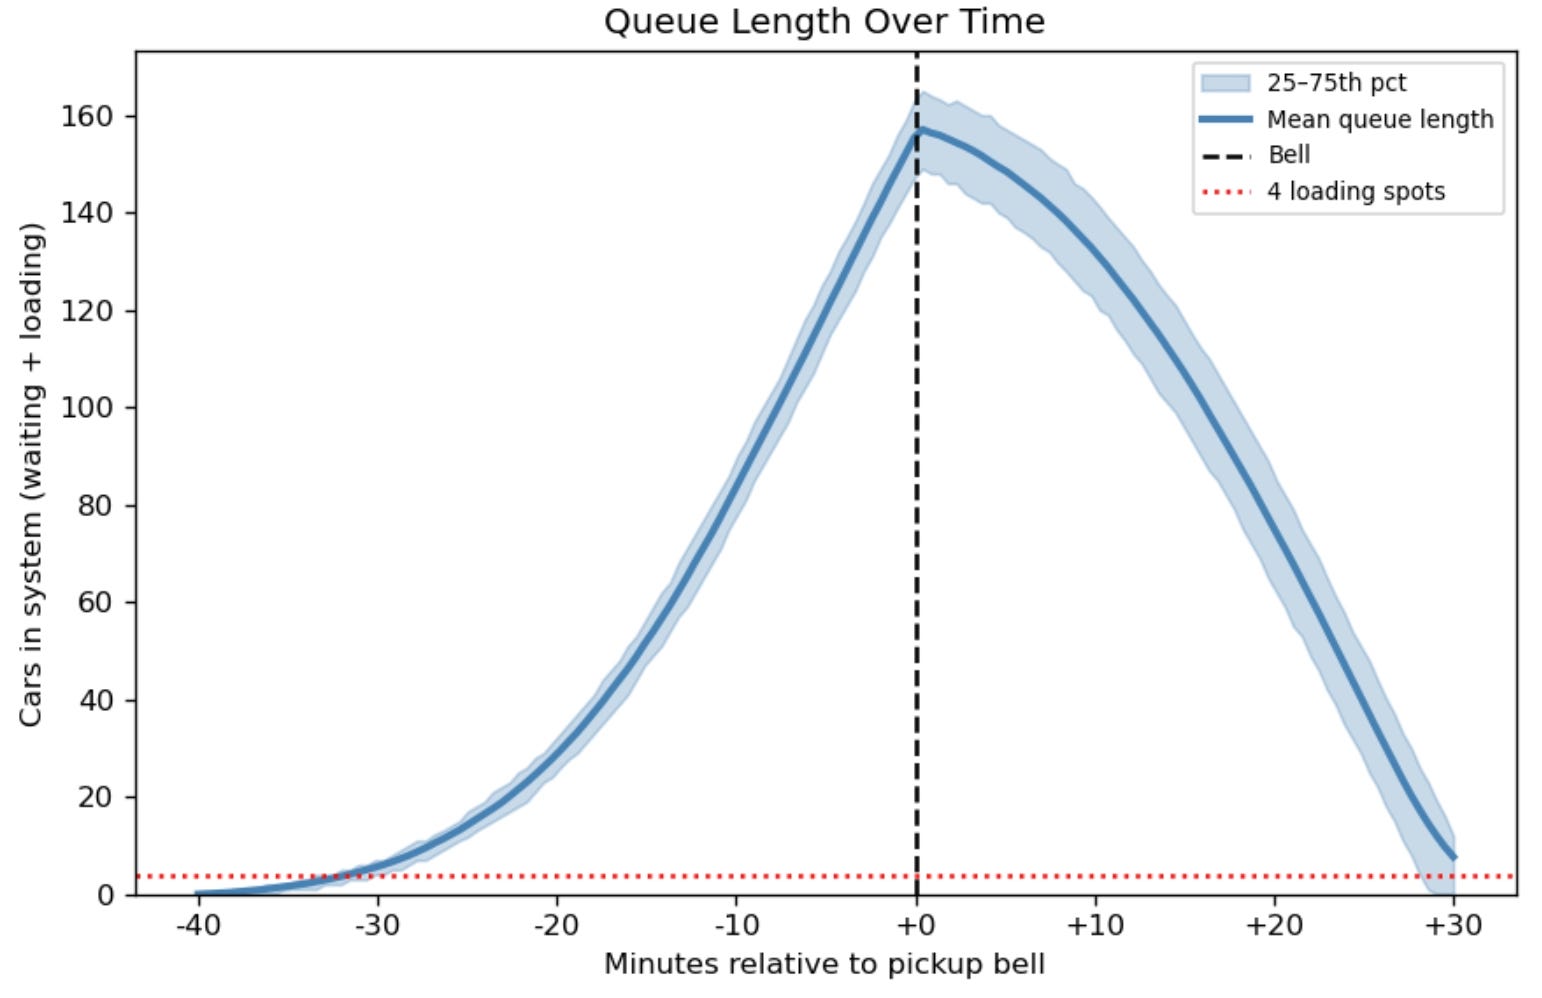
Next is what the queue (carpool line) looks like over time, factoring in the loading of kids once we reach +0. There’s always someone who shows up as soon as the doors open (~40 minutes before pickup). The line builds until it peaks right around +0 when kids start getting loaded. From there, cars start leaving the queue, but a few stragglers (again, like me) are still arriving so it stays somewhat flat before dropping off.
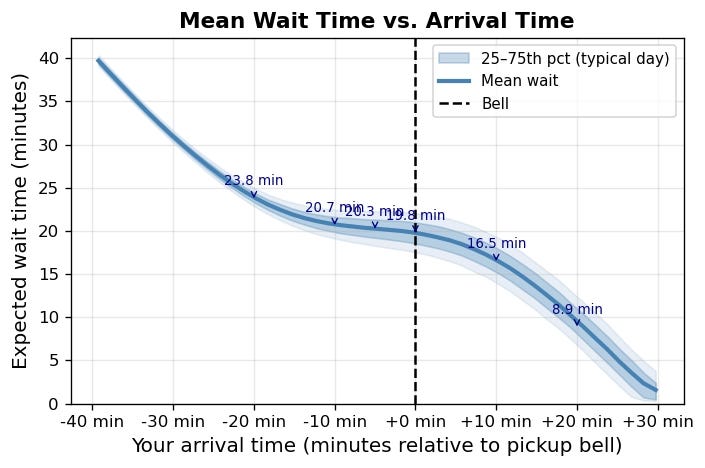
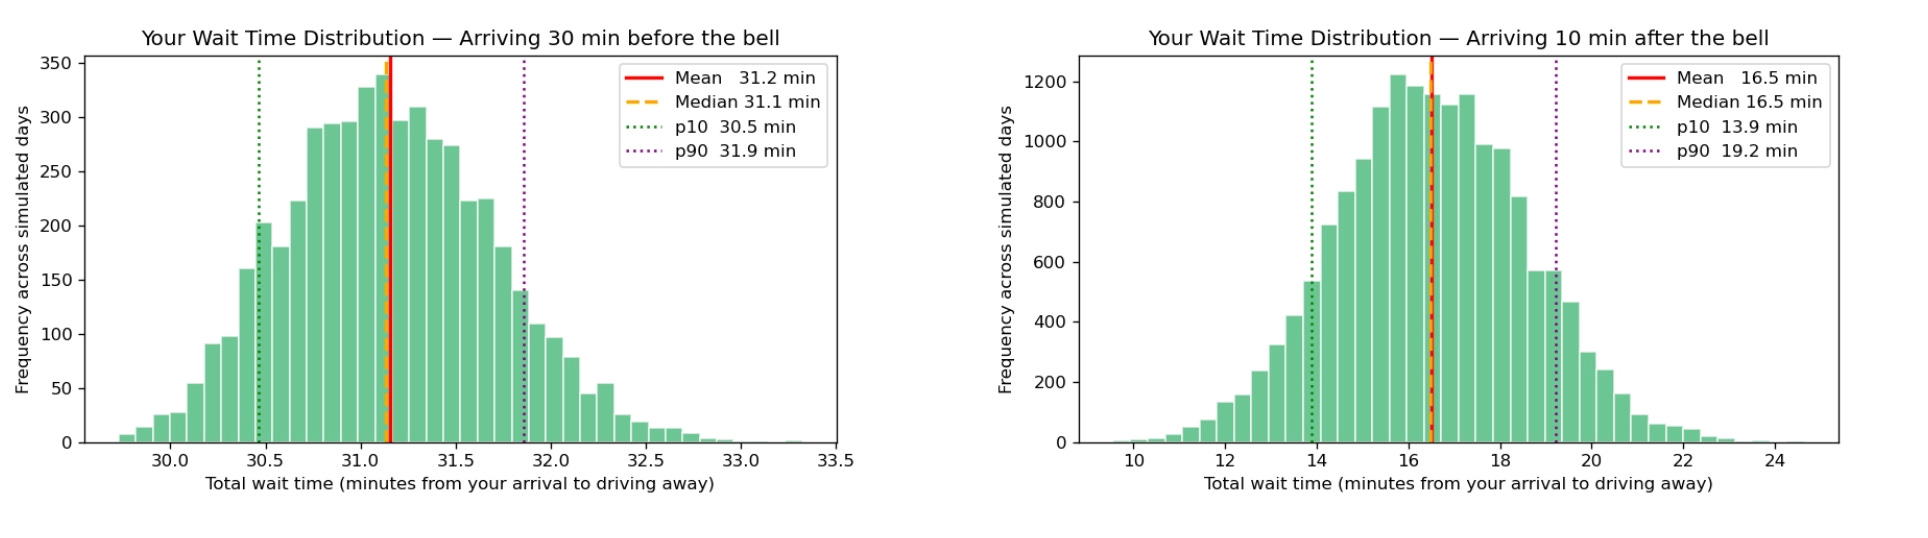
Finally for the most important part, combining the two pieces of information above, we can get a sense of the total time you spend getting your kid, depending on when you arrive. We can also look at this in distribution form for an early arriver vs. later arriver further below.
What This Means for the “Arrive Late” Strategy
The data tells an interesting story:
Arriving early is the worst strategy for total time spent (sorry honey). If you show up 30 minutes before the bell you’re sitting in line for over 31 minutes on average. Yes, you picked up your kid almost first, but you waited at least 30 minutes up front to be able to do that.
The wait time begins to taper off right when the bell goes off to ~20 minutes. This is when the queue is at its maximum point, but you’re only waiting for the cars in front to pick up their kids because pick up has already started.
The magic spot: if you wait it out and arrive 10 minutes after the bell, your average wait drops to just 16 minutes which is shorter than someone who arrived 20 minutes early.
Wrapping Up
You’ll notice that arriving 20 or even 30 minutes after the bell means you can almost pull right up and grab your kid. That makes sense intuitively, but I choose to live by the “happy wife = happy life” motto and 10 minutes after the bell is about as far as I’ll push it.
P.S. Other Scenarios are Possible Here
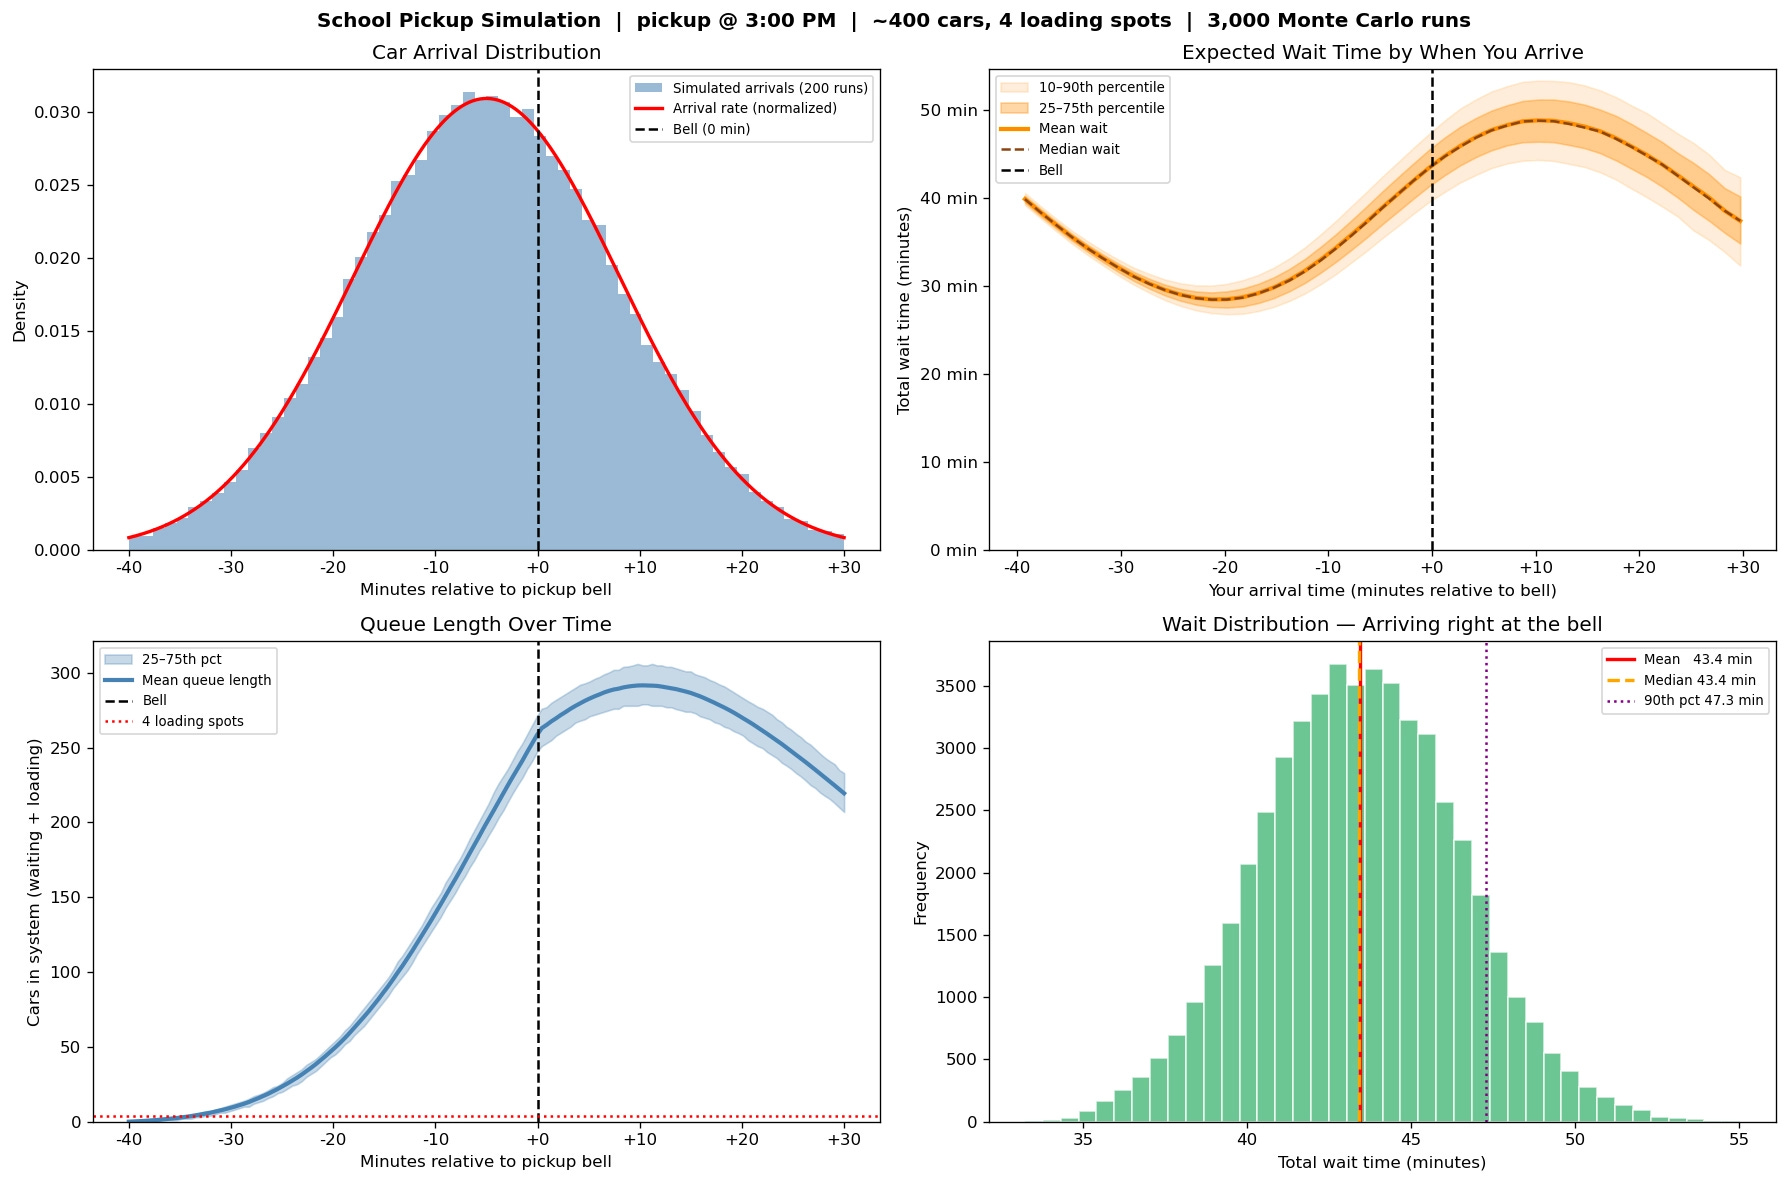
What I showed above, was custom tailored to my daughter’s school and from my sense checks on it, it seems to match. But if we increase the number of kids to be picked up, or we change how long it takes to pick someone up, or any of the other parameters, we can end up with quite different results. And in particular, ones where you would want to get there extra early if you can.
Here’s an example of loading 400 cars (vs. 240) and a slightly longer pickup time per kid. In this case, there’s a sweet spot about 20 minutes before pickup starts.