What's the Corrosion Allowance for the Iron Throne?
And is the Red Keep a corrosive environment or just toxic?
Forged from the fiery breath of Aegon’s dragon, Balerion, the Iron Throne survived for generations of kings. Did the extreme temperatures from the dragon’s fire form a protective layer of siderite so no corrosion would destroy the throne?! Was it coated with inhibitor? We seem to have lost this knowledge and are forced to deal with corrosion in oil & gas operations, in other more practical ways than dragons, at a cost of over $1 billion / year.

Oil & gas field infrastructure design requirements are well beyond what our modern dishwashers will withstand: field life estimates are typically specified as 30+ years in the offshore industry due to challenges with inspection and replacement. The largest risk for integrity failures is corrosion, where some reports claim as high as 50% of failures involve corrosion-related causes.
For this article, we will focus on internal corrosion mechanisms related to the production of oil, gas and water from the rock face all the way to the point of sale. For all the Tyler Durden fans out there, your single serving corrosion summary is this: stand-alone corrosion models should be complimented with multiphase fluid flow modeling and laboratory testing to account for many dynamic and nuanced variables that will greatly influence corrosion mechanisms. Further, no single corrosion program is 100% effective and when possible, mechanical and chemical mitigation efforts should be combined together and include routine monitoring to ensure proper protection has not dropped below minimum requirements.
Using broad strokes, an integrity program should include the following in the risk analyses:
Construction Materials - balancing resistance to corrosion, composition of produced fluids (oil, water, gas), total cost of construction, and life of field can make these decisions complicated and nuanced.
Corrosion Allowance - in a world where 100% corrosion inhibition is not possible, the production life cycle, such as flow regimes and gas and liquid velocities must be considered while accounting for “wear and tear”, thus allowing some sacrificial wall amount that we are comfortable losing.
Mitigation Methods - field design and expected production profiles will influence how corrosion might be controlled. For example, will the field have mechanical, or chemical, or both means to maintain high integrity? Will there be solids produced or sour gas or evolving water compositions? How will the field corrosion be monitored?
As we bend the knee for internal corrosion, we will focus on mechanisms associated with material loss corrosion (external corrosion mechanisms and environmentally assisted cracking, while equally critical, will be covered at another time). Some examples of material loss include sweet (CO2), sour (H2S), top-of-the-line (TOL), under deposit, preferential weld, and microbial induced corrosion (MIC) and chemical- induced corrosion. Several variables are often in play simultaneously, which complicates the corrosion picture.
With so many dependent variables, how can we be sure we aren’t being too conservative or aggressive? Is there one thing available we can rely on that captures all risks? Spoiler Alert: no there isn’t. Collectively at Pontem we have almost 100 years of corrosion experience, and our approach will probably shock no one who knows us. The complexity of fluid flow dynamics, for example, will influence the various corrosion mechanisms and we include this in our analysis to develop a more holistic mitigation program and account for things pure corrosion calculations don’t. We’ll touch on some of these issues in this article as we’ll begin with some corrosion fundamentals.
Sweet corrosion, or CO2-based corrosion, requires water to be present. Dry CO2 gas is not corrosive on its own under typical production pressures and temperatures. When water and carbon dioxide are combined, the corrosion process can be expressed as a redox reaction. Shown below, CO2 dissolves in the water phase resulting in the formation of carbonic acid. This industry accepted mechanism developed by de Waard (C. de Waard and D. E. Milliams, Carbonic acid corrosion of steel, Corrosion, 1975, 31, 131.) is further summarized as:
With the net chemical reaction expressed as:
Sounds simple enough. So, if water and carbon dioxide don’t touch the pipe then corrosion doesn’t occur, right? Technically? I mean, there needs to be something to corrode, right?! Some mechanistic papers have pointed to the need for pipe walls to be sufficiently “water-wet” for corrosion processes to occur. Using internally lined flowlines is a known solution to protecting the pipe after all. The general thrust of the emulsion argument is based on liquid fluids emulsified as a water-in-oil emulsion keep water from contacting flowline walls. The pipe is not “water-wet” and hence corrosion will not occur (or will be reduced). I will admit to have seen fields with the components of a corrosive environment (and models show it to be corrosive), however inspections and monitoring programs have revealed no active corrosion occurring. Before you go and shut off your corrosion inhibitor injection, I will also say it is a brave or foolish corrosion engineer (depending on your perspective) who relies solely on water-in-oil emulsions preventing corrosion for the life of the field. The numerous corrosion failures in oil export lines with water content <3% show that to be the case. Low spots in the flowline or a destabilized emulsion can expose sections or the entire production train to a sustained water wet pipe section, which will result in active corrosion processes. For this reason, we generally consider corrosion as an active risk anytime water is present. In fact, we have developed conservative mitigation programs for fields to include corrosion inhibitor injection, even though water has not broken through, yet. So before solely relying on emulsions to prevent corrosion, it is strongly recommended to thoroughly investigate this risk-based approach.

Wait…why are my models different?!
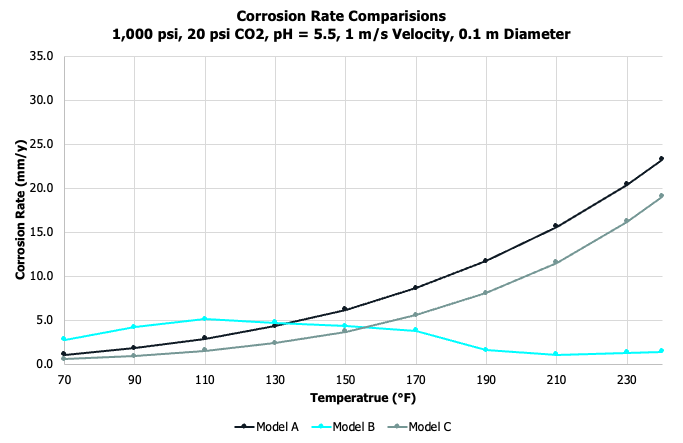
General corrosion rates depend on a number of variables. A partial list includes pressure, temperature, gas composition (namely, the acid gases CO2 and H2S), brine composition (ions, alkalinity, pH, volatile fatty acids), and flow regime. Models will account for these variables in different ways, which can impact the overall results. Consider three industry accepted models, which provide general corrosion rates for a system. Below we compare corrosion rates as a function of temperature. The rates are expressed in millimeters per year (mm/yr) and represent an average decrease in wall thickness over time. (The other common unit is mils per year (mpy), where a mil is 1/1000 of an inch. One mm/yr = 39.4 mpy).
Depending on the input variables and which model used, corrosion rates look downright scary to fairly manageable. And if one looks at multiple models, there may be good agreement or a divergence of rates! It’s important to helicopter up at this point and emphasize why this is important and what the goal should be. The true value of running models and performing lab tests is to ensure the field design is engineered within the performance requirements. Simply put, will the flowlines and infrastructure last throughout the life of the field. If I design on an estimated 30-year field life and my equipment will be installed to withstand 3-mm CA (corrosion allowance), I need to ensure the corrosion rates are less than 0.1 mm/yr! And, by the way, if a corrosion inhibitor is included to achieve < 0.1 mm/yr, we need to account for pump uptime efficiencies.
Aside from models, several laboratory tests are available to measure corrosion rates and inhibitor efficacies. A short list includes wheel box tests; electrochemical tests, such as CO2 bubble cell test (using an LPR probe (linear polarization resistance probe)) or RCE (rotating cylinder electrode) test; coupon weight loss tests, such as RCA (rotating cage autoclave) tests; jet impingement tests; and flow loops. There are advantages and disadvantages to each and each test will focus on critical investigation of different parameters.
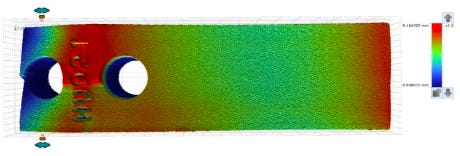
We ran a set of conditions shown in the models above under RCA conditions to evaluate whether a 3-mm CA could be achieved with chemical inhibition. The RCA set-up is a versatile test that allows one to consider and control a number of variables, including sweet and sour conditions (CO2 and H2S), shear rates, inhibitor partitioning (with the inclusion of a liquid hydrocarbon phase), metallurgy, temperature, pressure and fugacity. The output is a general corrosion rate based on loss of mass from the individual coupons. Additional post-test processing can provide details on localized corrosion (pitting) with profilometry analysis.
We found the uninhibited case to be in good agreement with the models, and noted severe pitting coupled with the high corrosion rates. A dose rate response was noted with the CI, and at the highest dose rate tested, the corrosion rates fell below the required 0.1 mm/yr CA and localized corrosion was arrested.
But wait, there’s more!
Complications arise when introducing other operation processes. Consider systems that utilize MEG (mono ethylene glycol) for hydrate control. While I’ll save the juicy details for my follow-up post (I’ve already titled it “Steven Segal is INHIBITING CORROSION”), MEG can significantly reduce corrosion rates. Or consider higher temperatures can promote iron carbonate scaling, while this is absent at lower temperatures. So, sometimes we see passive films form (good), but sometimes the film isn’t uniform (bad).
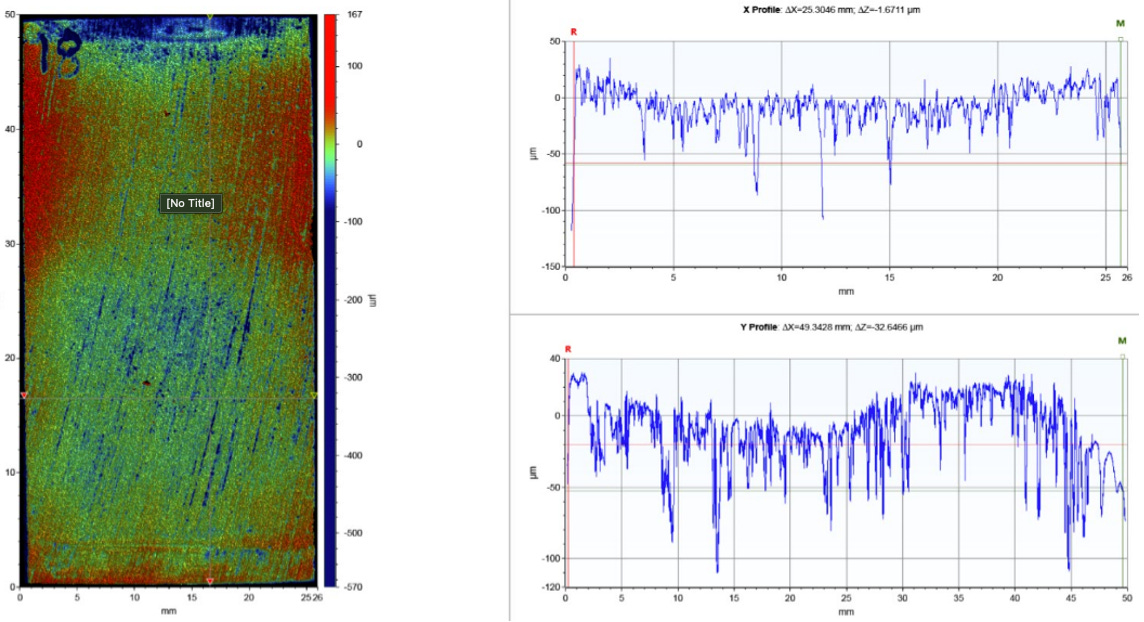
Our understanding of fluid flow has been critical in how we approach corrosion management. I mentioned two specific environments in the introduction: top-of-the-line (TOL) and under-deposit corrosion. It may not be intuitive when a system is susceptible to corrosion under these environment. Briefly, TOL corrosion occurs when water vapor condenses on the top of a pipeline and there is not an active or consistent event to sweep the water from the surface. To understand this risk, we need to calculate the water condensation rate at specific locations on the pipe, which is highly dependent on the thermal/hydraulic behavior of the pipeline. If a gas system is predicted to slug, we may recommend including a downhole injection for a corrosion inhibitor because it is likely in this scenario it will reach the top of the pipe. Otherwise, if there is no slugging, the corrosion inhibitor will remain in the bottom half of the pipe (or 6 o’clock position). Understanding solids transportation (and/or development of microbial deposits) risks will help in determining the likelihood of solids depositing in the flowline and whether that needs to be dealt with through a pigging program or selection of a corrosion inhibitor that can penetrate under the deposits formed.
Localized corrosion
How is localized corrosion different than general corrosion? More commonly known as pitting, this corrosion mechanism begins when there is a differential potential across a specific location. This can occur (but is not limited to) if there is a break in a coating on the metal surface (either a protective film, chemical inhibitor, an inorganic passive film, or other deposit). Once this begins, the localized corrosion rate often becomes self-propagating and the rate of corrosion can be orders of magnitude higher than that of a general corrosion rate. An under deposit schematic is shown below.
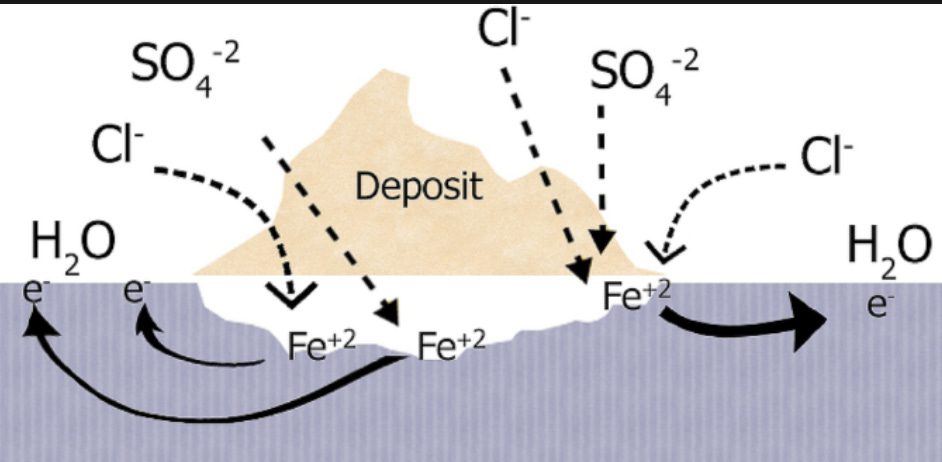
Brine composition is important in understanding what corrosion mechanism(s) is active. For example, high chlorides are associated with a more corrosive environment, and specific to pitting mechanisms chloride ions are associated with increasing the disruption of a passive film formation. Aside from the action of the chloride ions, the rate of pit growth is dependent on the outward diffusion of the corrosion byproducts.
The presence of volatile fatty acids (VFA) in any brine composition is frequently overlooked when evaluating corrosion. Acetic acid (the most common VFA, although all VFA’s act similarly) can reduce the pH of the system and also disrupt any protective inorganic scale coating causing the actual corrosion rates to be a factor greater than the predicted rates if they have not been included in the actual calculations.
In one offshore field, we noted two lines with vastly different coupons that were pulled at the same time. In the first case, we noted a general corrosion rate of 0.05 mm/yr and no visible pitting.
Another line operating on the same platform showed a much different analysis. General corrosion rates were calculated at 0.8 mm/yr, based on weight loss and severe pitting was noted, with multiple pits greater than 200 micrometers.

The results prompted a re-evaluation of the line at an increased rate and a program to qualify a more appropriate inhibitor.
When considering the specific corrosion conditions at each location of the corrosion monitoring equipment, it is important to ensure any corrosion coupon or probe is installed in the correct part of the line, i.e. 3, 6, 9, or 12 o’clock position. Depending on the flow regime there may not be much corrosion at the 12 o’clock position, however the 6 o’clock position has accumulated most of the water due to stratified flow conditions, and hence most corrosion will occur in the bottom half of the pipe. In this instance, the wrong location of a probe will give a false analysis of potential corrosion.
How does pH impact corrosion?
Let’s go back to our model system and look at how corrosion rates vary with pH. While the models all look different, they all trend the same way: increasing pH will lower the corrosivity of a system. And remember, pH is taken on a log-scale, so small numerical changes in the pH value are actually larger than they may appear.
We tested our model system in RCA tests and results, along with pictures of the coupons are shown below. A few trends are immediately noted: corrosion rates decrease with increasing pH; under lower pH conditions localized attack is noticeable compared to higher pH; and the corrosion rates are much lower overall compared to the models.
This process is a lot worse for systems where acid stimulation well treatments are performed or acid based production chemicals are injected. In these instances the corrosion is so aggressive a failure may quickly occur.
Why do the lab tests differ from the models? As eluted to earlier, multiple factors contribute to the water wetting of the metal surface, and ultimately to the severity of corrosion. Specifically, some of those parameters include,
Flow regime and flow rates
oil/water ratio
emulsion characteristics
Partitioning of any corrosion inhibitors
surface roughness and cleanliness
scaling effects
Field monitoring should be part of all integrity mitigation strategy. Onshore pipelines are obviously more accessible and wall loss can be directly measured through inspection tools, such as ILI imaging. Offshore fields will often attach Field Signature Monitoring (FSM) systems to the outside of the pipe and/or include corrosion ring pair monitoring devices in subsea pipelines. Offshore fields will often install coupons and/or corrosion probe ports, which are inspected every 30-180 days, depending on the severity of the system and program details. Other corrosion monitoring systems can provide continuous corrosion monitoring capabilities thus allowing real-time understanding of the corrosion occurring.
Can we protect the Iron Throne?
Now that we’re armed with corrosion knowledge, what is a reasonable corrosion allowance to ensure the rulers of Westeros have somewhere to sit for another 300 years? Let’s assume the siderite caused by the dragon’s flames has prevented any corrosion from occurring. However, with so many usurpers in Song of Fire and Ice, it is also safe to assume all the coming and going has rubbed off the passive film. And we know winter is coming (water and corrosion). The throne will be exposed. Let’s assume:
1,000 sword construction and 20 swords thick throne.
Each sword is 4.6 mm, which is a reasonable broadsword estimate, for a total thickness of 92 mm.
Life of throne: another 300 years and we need 80% thickness to maintain integrity.
That calculates to a corrosion allowance of 18.4 mm, and a corrosion rate of 0.06 mm/yr. Westeros better find a good corrosion program!


