In oilfield production, fluid analyses are important measurements in many phases of development and operations. Compositional analyses provide valuable insights on:
short-term and long-term production forecasts
red flags for any safety risks from an exposure or integrity point of view (H2S, radioactive scale or high Fe / Mn readings to suggest possible severe corrosion)
input parameters for thermal-hydraulic models
We spend time (and money) collecting pre-production samples via either downhole sampling or well test (DST, flowback, etc.). Appraisal activities range from collecting data to delineate the reservoir including size/reserves, as well as identifying the gas/oil/water contacts. Samples may be collected from any phase encountered, with the focus primarily on the monetizable hydrocarbon (gas / oil) phases. But, if we encounter water, how much time/effort can be justified to accurately sample the aqueous (water) phase? And, if we are drilling with a more eco-friendly water-based mud, how are we going to account for contamination of the mud ions in the sample?
Following start-up, routine water analyses are generally taken monthly. If one were to survey operators and petroleum engineers, one common thread you hear is the limited value in a single water report. Instead, there is more information for a proper system analysis when trending compositions over time. For example, let’s say a field has a threshold of < 50 ppm iron (Fe) and readings above this will trigger actions to counter the increased corrosion risks. A single water analysis that reports 55 ppm Fe would set operations into motion, however what is the real risk? We would feel more concerned if iron counts for the last 6-months were on the order of 20 ppm, and after the high reading continued to show elevated iron. However, if there hadn’t been a recorded water analysis for several months we are a bit in the dark. That analysis might be an indicator of active corrosion. Or it could be lingering effects from an acid job. Or the sample pull corresponded with a new well coming online and the commingled sample has higher iron compared to when specs were originally established. Or could the sample be contaminated? Not all data is created equal and anyone can have a good (or bad) day, but true behavior is revelated through patterns.
So, if we can all agree trending water analyses is a good idea and produces good data, what is the best option during early appraisal of a new field development, when only one or two samples may be collected? Furthermore, it is generally acknowledged that there are inaccuracies in initial water samples, both from the actual sample collected, as well as when the samples are blown down to atmospheric conditions for ion analyses (i.e. the impact of dissolved CO2 being liberated). We explored this question in a recent study when asked to validate fluid compositional analyses for a new field (and basis of design), answering the question, “Is this water composition correct?”
Case Study
This case study is based on a gas development in a frontier basin, planning an MRU (Mono-ethylene glycol Reclamation Unit) for hydrate mitigation. We were provided fluid analysis reports from collected downhole samples some 3 years prior, which we applied our QC process to output a tuned water composition. The MRU design is based on expected field water rates and ion compositions, which will drive expected salts handling designs and expected chemical consumption. Not only are decisions made on certain chemical and operational practices, but design specifications costing $10’s of millions are based, in part, on these water analyses. No pressure, right?!
While several variations exist, the basic premise for the MRU utilizes four steps to convert incoming “rich MEG” (produced water / MEG) from the field to departing “lean MEG” (purified / concentrated MEG) suitable for reapplication.
Pre-treatment by degassing and condensate separation by heating rich MEG in a flash drum for hydrocarbon removal
Treatment with sodium hydroxide or sodium carbonate in the next stage to drop out divalent ions. The resulting solids are removed by filtration and disposed of onshore.
Reclamation of the rich MEG, to remove high soluble salts and other nonvolatile contaminants.
Regeneration of rich MEG to a higher concentration (>80wt%) via removal of water to yield lean MEG for reinjection;
The above process utilizing pre-treatment systems and vacuum reclamation allows MRU’s to avoid unit fouling challenges by removing the soluble monovalent salts from the incoming / processed MEG. Additionally, divalent salts are removed before they reach the reboiler.
Chemistry 101
Valence: # of chemical bonds each atom typically forms
Monovalent: NaCl, KCl
Divalent: Ca2+, Fe2+, Mg2+, Ba2+ and Sr2+
This process is important because if the divalent salts remain in the rich MEG (even at low concentrations), they will foul the MEG reboiler where temperatures are in excess 160˚C. While these process improvements in MEG technology are impressive, there are still challenges in dealing with high TDS formation brines as MRU design teams must account for the accumulated mass of salts as water rates increase over the life of the field. In fact, be on the lookout for an upcoming post by our own Stephen Hamilton, as he shares some of his 25+ years of experience with MRU processes!
Data Collection
Here, we focus on the brine analysis from one well and related it to MRU design. Ensuring an accurate and realistic estimation for water composition analysis is the critical first step. Over- or under-estimating the brine composition and salinity can be a costly error (a) on the MRU design end, and (b) on the ability for the field to efficiently operate at maximum production rates for years.
From the onset of this project, things were atypical. Normally, new field developments will acquire only one or two water samples . If there are more, they are from different depths, or different zones. In this instances we were provided SIX (6) water reports from one well, all collected from the same depth! This turned out to be a blessing and a curse, but we try to find the good in people (samples)…
So, which sample do we use? At first glance, many of these samples may appear to be “close enough.” However, in terms of MRU design, the difference between 41k TDS (Sample 1) and 18k TDS (Sample 4) is enormous in terms of capacity to process tons of salt, annually. And why - after millions of years in geologic time to equilibrate - are we seeing different results from the same zone?
Challenge #1: Missing Ions
Analyzing any given sample did not give us all the ions necessary. Were they not detected, not measured, not reported, or something else? In this specific case, the chain-of-custody on how the samples were collected, depressurized, sub-sampled, titrated, and preserved was both (a) not accounted for and (b) not assessed with the knowledge that the field was considering an MRU. While this is a ‘chicken-and-egg’ issue (early analysis may not know the field development concept), early engagement with a wider systems-level approach may provide valuable feedback into those early sampling programs and required analyses. In this case, taking an average composition did give us a complete set to examine, which as a first-pass we landed on as an acceptable starting point.
Challenge #2: High Calcium (Ca)
We suspected the samples may be contaminated with drilling fluids, which often are composed of a variety of calcium chloride solutions (CaCl2) as well as solid calcium carbonate, added as a bridging agent and drilling fluid density modifier. This was confirmed after a quick glance at Sample 1, for example, shows the highest levels of calcium and the sodium/chloride ratio is entirely too low. While not a hard rule, a 1:2 ballpark ratio (Na:Cl) is an easy check to see if there are potential contamination issues. We couldn’t determine much else with Sample 1, especially since alkalinity and volatile fatty acids were not measured. So, we eliminated this sample from the matrix. The Average composition listed above (right column) is an average of Samples 2 - 6.
As it turns out, sometimes, we are even too smart for our own good. We suspected that there might be too much calcium in the water, based on (a) gut-feel, (b) rules-of-thumb, and (c) scale / saturation modeling, etc.. But, there was something else that could have pointed us here quicker - getting our hands on the drilling mud report itself! When we finally asked - lo and behold - look what we found. As close to a ‘smoking gun’ as there is. Call your local drilling / completion engineer often!
Challenge #3: Reservoir Saturation
The next stage in QC’ing a water sample is to run a correction back to reservoir pressure/temperature to determine if there are indications of supersaturated concentrations. When the water samples are blown down to be tested, the reports are generated at atmospheric conditions. We need to ‘back-calculate’ how those analyses may look at the true, downhole conditions the sample was collected at. The fluids in reservoirs have reached geothermal equilibrium after sitting in the rock for millions of years making it impossible to have a supersaturated ion concentration. If we predict that to be the case, then something is off. We can still have a cation/anion balance in the reported data (which often ticks the initial QA/QC box), but we can have too much of both species, which is revelated during this correction process.
For this, we used an industry-accepted scale modeling program and incorporated liquid hydrocarbon / gas compositions. Many inorganic scaling salts are pH-dependent, which requires dependable measurements of acid gases (CO2 and H2S), as well as aqueous pH, alkalinity, bicarbonate, and other weak acids that impact pH. This turns out to be an important point and I’ll dive deeper into this later, however for now I will point out the simple correlation between alkalinity, pH, and solubility of calcium carbonate (calcite).
Increasing the alkalinity of an aqueous solution will raise the pH, which in turn will decrease the solubility of calcite. In terms of a reservoir aquifer, the higher pH will result in a lower saturation concentration of calcium ions. This means an artificially high alkalinity number may provide a false over saturation result for calcium ions.
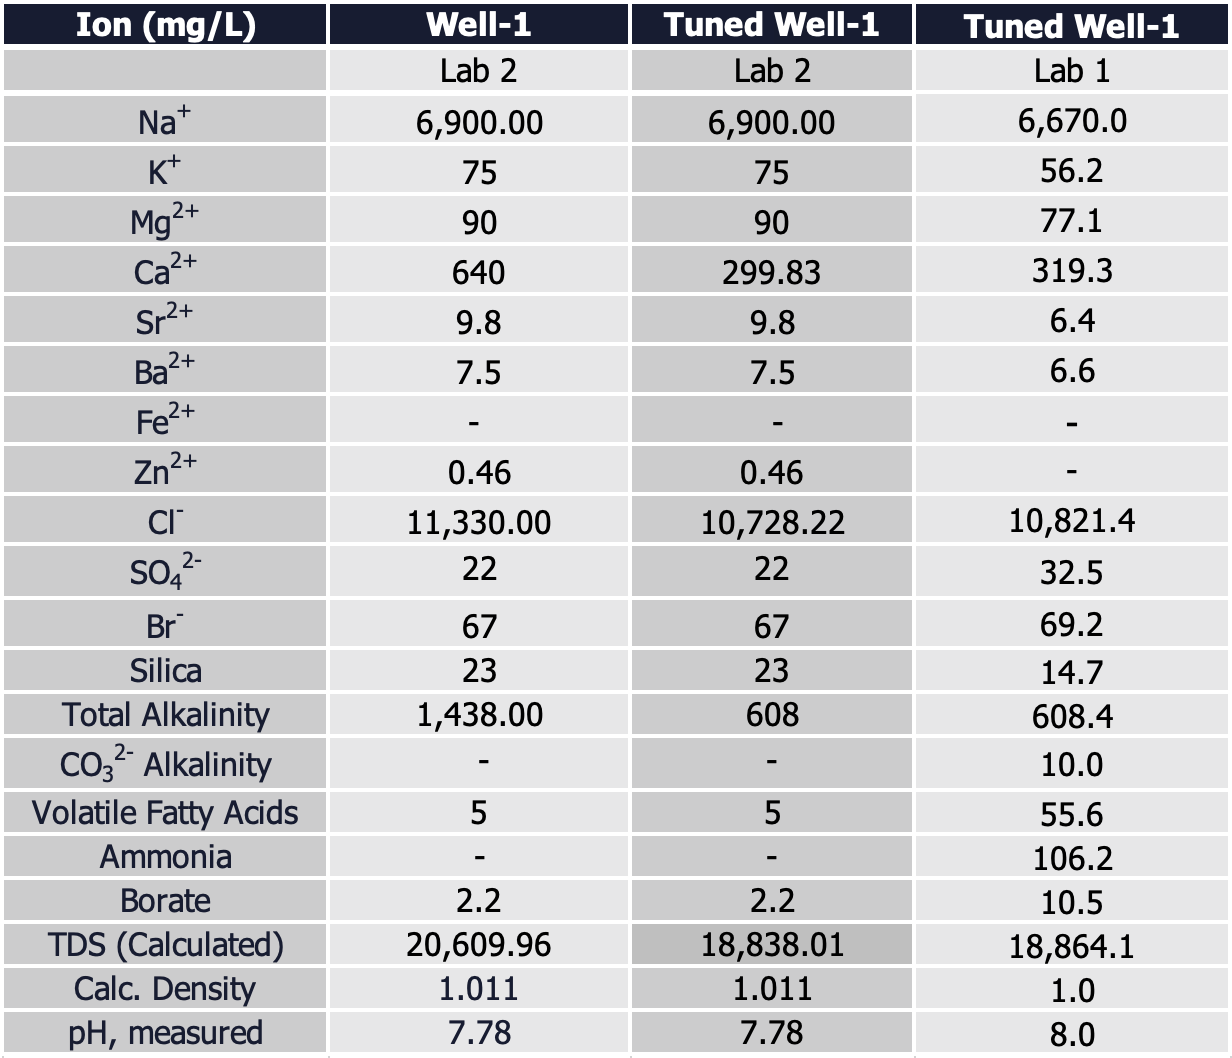
Tuning to reservoir conditions, we found calcium to be supersaturated, which confirmed our suspicions of contamination with drilling fluids. The tuned water composition removed calcium ions back to saturation levels at reservoir conditions. We assumed the counter-ion for calcium to be chlorides, which also required tuning. The updated water sample (after removing the excess calcium and chloride) compared to the initial, average composition looks like:
It is important to point out the tuning process does not insinuate a “correct” composition. It is a conservative estimate only removing the minimum concentration to achieve reservoir saturation. In this example, the calcium levels could be lower than 319 ppm, however based on the input variables it is not possible for calcium to be higher. So, it gives us a range-bound approach to get as close as possible, while still having some level of conservatism.
Challenge #4: Multiple Laboratories
In addition to the missing ions and some uncertainty around the QC process for ion balances, there were a few other issues with the sample analyses. Taken together, this presented enough uncertainty to warrant a second (complete) analysis to be run at a second laboratory, with a full chain-of-custody from sample blowdown to analysis.
Water samples from another cylinder collected at the same time from the same depth were analyzed, so the results should be an apples-to-apples comparison across labs. We were also quite up-front with the second laboratory on the goals of the project, including the ions we specifically were targeting (now knowing that we were looking at an MRU-level compositional breakdown). The single analysis and subsequent tuning is shown below with a comparison to the tuned water sample from the first lab:
Aside from high calcium in the native sample, the other measured outlier noted was the extremely high alkalinity number. By fixing the partial pressure of CO2, reported pH, and carboxylic acids, a calculated alkalinity value came back at 71.85 (mg/L HCO3-), which seems too low. So, what is going on?!
Challenge #5: Alkalinity - It Isn’t All the Same
Looking more closely at the analytical reports, it turns out the alkalinity numbers were measured via different techniques between the labs, which turns out to make all the difference in the world. Both labs reported valid numbers and ran proper procedures, however the type of analyses have different selectivity. So, the context of how the number was obtained matters. And, this is VERY easily lost when discussing only the end-point (reported) number. What did Maximus say in Gladiator: “What we do in life echoes in eternity”. Well, once a number in a lab report is published, that number seems to echo in eternity…
Alkalinity, broadly speaking, is a summation of all species that can neutralize a strong acid. Often times it is expressed as mg/L HCO3-, however it could be a reported measurement of CaCO3 concentration.
It turns out Laboratory 2 employed a titration method, which is an endpoint titration and will measure all bicarbonate, carbonate, acetate, and other weak acid components. Laboratory 2 also ran a “Rice Titration” analysis, which involves sparging the sample with 1% CO2 in N2 to saturate the sample with CO2. A titration is carried out to an end pH of 3, and a processing calculation to estimate the concentration of organic acids. After back-calculating this value out, the final number is a reported HCO3- value (in mg/L).
Total Alkalinity (via Titration): 1,438 mg/L
Bicarbonate (HCO3-, via Rice Titration): 312 mg/L
Laboratory 1 employed ion chromatography techniques, which offers an advantage in our case to isolate and differentiate species, allowing one to report a measured bicarbonate value:
Bicarbonate (HCO3-, via Ion Chromatography): 608 mg/L
So, what did we do? We punted…kinda. We felt reasonably confident the contamination was a mixture of calcium chloride and calcium carbonate from drilling fluids. Given Laboratory-2 did not run a specific technique to isolate the bicarbonate from calcium carbonate (although we had an indirect and calculated value), we made a decision to use the bicarbonate numbers from Laboratory 1 to tune Laboratory 2 calcium values.
Keep in mind, the goal of this exercise was to determine a reasonable water composition to base the MRU design on. Overly conservative estimates would require a potentially over-sized vessel to process the salts, while overly aggressive estimate could eventually lead to an MRU with fouling challenges because it wouldn’t be able to handle the formation water coming through. Hence, the rationale for landing on bringing the salinity to saturation. And comparing the two tuned analyses, we find virtually the same TDS, divalent cations are within 5% of each other, and chlorides are also in agreement.
Golden Ticket - Time Series Data
While we felt confident in the QC process and the estimated composition made sense, we still felt we went through a bit of hand waving. Just reducing ions because we knew they were too high was directionally the right approach, but it still felt a bit…cheap. After more discussions with the D&C team, we were provided with the sample collection log. Given so many samples were taken from a single well at a single depth in the same operation, we were able to plot the sample concentrations as a function of time. Context is everything.
The first sample with a water analysis was collected after ~6 hours of flow, with a reported calcium value of 7,790 mg/L. You may recall, this is Sample 1, which we threw out of our comparison based on our QC check. The chart above compares Ca2+, Na+, and bicarbonate levels as a function on time. It is important to reference the calcium to sodium, as we did not believe the drilling fluids to contain a source of Na contamination. And while there is some fluctuation, the sodium values are fairly consistent…which means the ions reported are probably accurate. For a given point-in-time.
Note: this isn’t a matter of just taking the “last” data point always and assuming its the best one. Again, behavior over time. As noted, there could be events that occur later in the flow period that would make these samples less accurate. However, given that we have the full picture of what happened, we can use the time data series to put the samples collected into a wider context and make a more ‘systems-level’ decision about the data we trust.
As suspected, the well continues to clean out the drilling fluids and note a sharp drop in calcium values, followed by leveling off. Let’s take another look at our tuned analyses and compare them to the last sample taken (Sample 6, with no tuning):
Sample-6 does have some missing ions that were not analyzed, however there is good agreement between all three data sets. Certainly, the results are all within the instruments’ standard deviation used to analyze the water samples. Interestingly, comparing Sample 6 to the Tuned Avg Lab 1 composition, we note the calcium is higher and the bicarbonate is lower in Sample 6. This makes sense as raising the bicarbonate levels will raise the pH and destabilize calcium carbonate in the reservoir, resulting in a lower tuned calcium value.
One last check: saturation checks under reservoir conditions showed no scaling potential using Sample 6 composition (for the ions present). So, which sample would you go with?! In the end, we went with the tuned Laboratory 2 sample. We recognized we used the HCO3- value from the other sample, however all the other ions were direct measurements from a single sample. We felt that was the least manipulated. We also had more direct control and communication with the lab throughout the entire process. Again, just getting a lab report with “a number” can be misleading.
Most of the time, we aren’t afforded this many samples to check for contamination. In the end, we feel confident about our QC process (basing steps on sound science and then being able to reach a similar conclusion from a different approach gives a higher degree of confidence). And that is a valuable lesson from this exercise: understand the question you are trying to answer and use tools you understand to make informed decisions. We allowed the data to drive the process and we landed on a composition we could stand behind.
So What? / Impact on Design
The “So What?” question is really the essence of where we want to get to. Sure, getting the ‘right’ (technical) answer on water composition is great…but what do we do with this information? And, was the effort time-well-spent? I mean, we all loving going down the rabbit hole, but hopefully it leads somewhere…
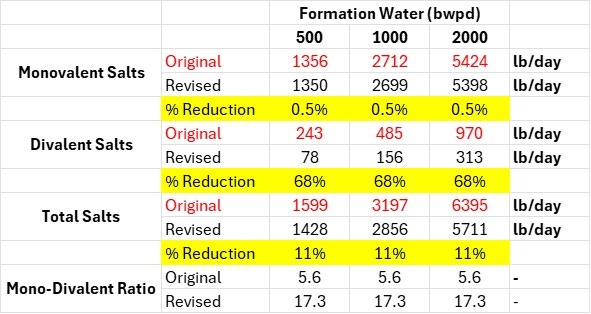
In this case, the water composition was being used to assess MRU design and solids handling requirements. Two significant changes emerged between the initial assessment and the final:
Divalent salts (Ca / Mg) reduced by more than 65%.
Mono/divalent ratio significant impacted
In both cases, the impact on the pre-treatment unit design, as well as the solids handling (which impacts logistics, environmental, and several other factors) have been reduced. Aside from the solids loading itself, this may enable alternate technologies for pre-treatment consideration that could improve efficiency and/or open the market to different technology providers. Oh, and let’s not forgot just how much salt is being handled on a daily basis through the units…
Closing Thoughts
Let’s close with a couple of questions to think about:
How important is collecting water samples, when we are in the business of drilling for oil and gas? Be honest…
What decisions do you make that depend on a reliable interpretation of data? And, how does that change based on development concept (hint, hint: MRU design…)
And, how important are those high water handling capacity numbers (for MRU sizing)? Constraining gas reservoir recovery by limiting water production is always a challenge…but the “cost” is not always just MRU footprint/CAPEX, but also the logistics of handling the produced salts. Knowing this (and accurate water chemistry) is a big factor.
So, next time the subsurface team wants to produce MORE WATER to get those extra reserves, maybe its time to challenge your Inner Waterboy..
One more shameless plug for Pontem: we’ll be posting about another example where getting water analyses right had a profound impact on field designs and mitigation options! Different organic chemistry lessons, same field development impacts.


