Optimizing Well Production
Challenges with a NE-TX gas field
It goes without saying… producing hydrocarbons is hard. From the pure technical aspect associated with identifying and extracting, to the volatility in commodity prices, there are a stream of never-ending challenges.
At Pontem we are fortunate enough to be involved in energy projects across a wide range of spectrums. Sometimes this involves managing production from a few offshore wells in 8,000 ft of water, 50+ miles away. Other times it means managing production from hundreds of wells in an unconventional onshore system. With NAPE upon the industry in Houston this week, we wanted to dive a little deeper into our onshore experience.
Like most companies, we share our successes, but we also believe it’s important to talk about challenges (and failures?) as well. Particularly when they can lead to better outcomes across future projects and help to push the industry forward. Case studies don’t always have to be pretty…they can be educational.
Background
Over the last year, we have collaborated with a small producer with close to 100 gas production wells in a prolific US shale basin. We have spoken about this before in a previous case study and our early efforts at production optimization for the asset.
In contrast to some of the offshore projects mentioned above that can produce several hundred million standard cubic feet of gas from each well, this field measures it’s gas production from a well in thousands of standard cubic feet. And it would be hard to discuss a field with that kind of production output without also mentioning the economic challenges associated with natural gas prices in the last year…
The field has all conventional vertical wells and has reached its brownfield status long ago. As a result, many of the wells produce significant volumes of water (sometimes including other valuable minerals in it, but more on that brine story coming soon…if you can wait for a Li-ttle while longer…). The water accumulates in the well eventually stopping gas from being able to produce due to the hydrostatic head under natural flow conditions.
As is typical of wells in this stage of production, many require some form of artificial lift to unload the water and enable gas production again. This particular field utilizes 4 strategies:
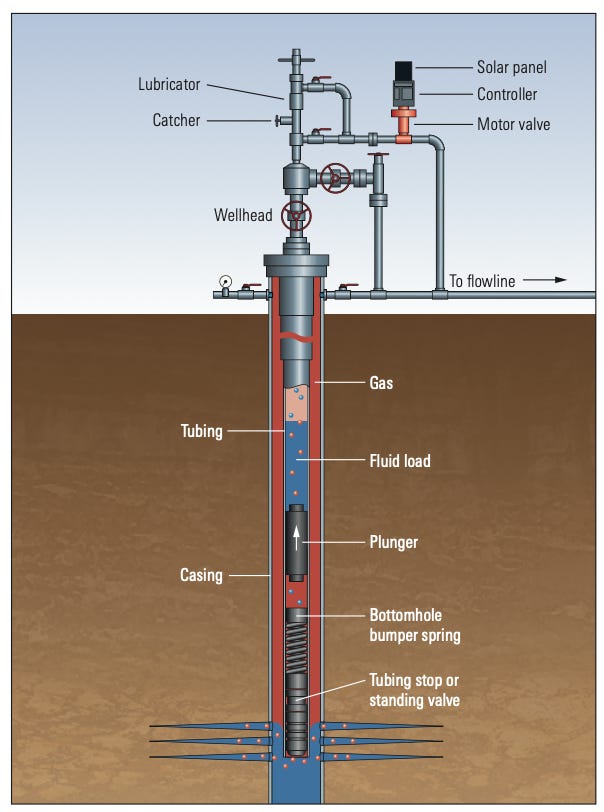
Plunger lift systems (like the one shown below), which are generally automated, but to varying levels of sophistication, with many systems still needing some kind of manual setting around the cycle times.
Pumping, which requires manual labor and thus increased OPEX, plus the additional ‘traveling-salesman’ problem of where do you send the pumper to next.
Manual shut-ins to allow skin (pressure) near the well to increase enough that the water can be unloaded naturally and flow freely for sometime before declining again.
Chemicals, usually foamers, that modify physical properties of the liquids, such as surface tension, which aid unloading
From the list above, #3 and #4 were our area of focus as a means of increasing production. Adding additional plunger lift systems and increasing personnel in the field were unfortunately cost-prohibitive with current gas prices. In fact, one additional challenge was presented with a downsizing of the operational staff, which lead to another variable - how to optimize production with limited resources.
Primary challenge: Access to data
Primary challenge: Existence of data
In our experience, most energy companies have realized the potential value in their data and they go to great lengths to capture as much of it as they can (and store it as securely as they can). Often times, our biggest problem isn’t having data, but rather not having access to it. (As a side note, this is why Pontem has partnered with companies like Aveva and Seeq, to streamline the access to data that enables Pontem to deploy models and analytics that interact with it.)
When we sat down with our client for this field, we were given a spreadsheet going back a few years that contained information around each well’s casing and tubing pressures and it’s gas production rates. The data supplied had a row for each day. Naturally we assumed this was a field-wide summary compiled for internal use…
Upon further discussions, we realized that this spreadsheet was not a summarized output of daily averages from their historian, this spreadsheet was their historian. No SCADA system feeding a control room, no PI system recording all that data in time, nothing…. Measurements were recorded manually by their crew as they drove around to various wells each day. The value recorded in the spreadsheet wasn’t an average, it was the instantaneous value (at whatever point in the day it was recorded). It also meant that missing data was scattered all throughout the spreadsheet for wells that weren’t visited on a particular day.
Quite the contrast to many oil and gas fields today and certainly not ideal for trying to optimize production with a data-driven approach. There is an inherent economic challenge in this push/pull dynamic: for smaller/marginal field with tight economics, optimization can be the difference between profit and loss….but that optimization requires some pre-investment (and commitment) that may or may not pay off. Often times, the easy answer is to “Do Nothing” and live with the ebbs/flows (pun intended).
So what can we do?
With financial constraints preventing costly new infrastructure or increased personnel, combined with the lack of operational data available, the honest answer to the question above is “not much”.
Nonetheless, we did our best to perform analytics on the data we had in the hopes of finding things would warrant further evaluation when the time (economics) are right.
Finding #1: Shut-ins are likely possible to optimize with a purely data-driven approach
One main goal in the analysis was to find evidence that optimizing the shut-in frequency for wells was possible. Again, when dealing with high amounts of missing data and only single instantaneous numbers, this isn’t straightforward to find. And the lack of any reservoir models, meant that a data-driven approach was our only means of performing this analysis.
We started first with looking at the number of shut-ins performed for each well and noticed 3 different categories of wells:
Wells that were currently being shut-in VERY frequently, presumably for liquid loading reasons
Wells that were previously not shut-in very often, but may just be starting to experience liquid loading issues
Wells that are still mostly free flowing and don’t require shut-ins except for reasons outside of liquid loading
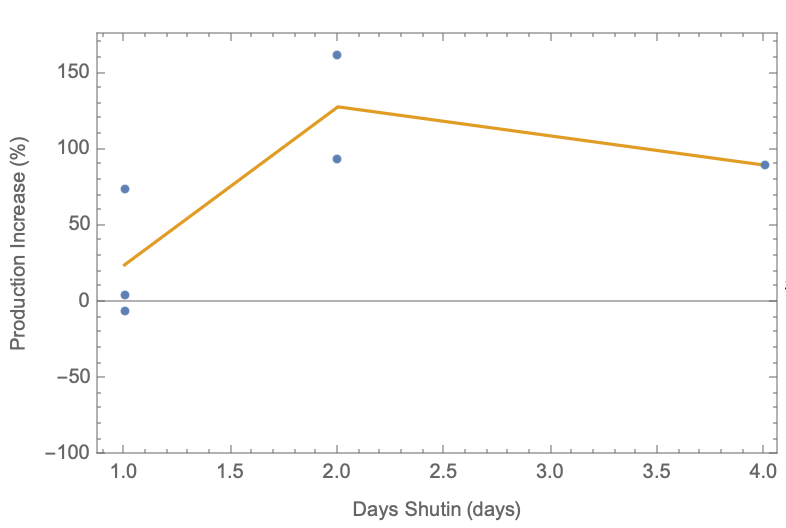
We focused on the first category of wells that were being shut-in frequently for further exploration. We created a new feature in the data that captured the production increase relevant to the last time it was flowing following various amount of time shut-in and we started to see encouraging patterns emerge in many wells.
An example of what we saw is shown below that indicated (again, acknowledging lack of granularity in the data) that we DO have an optimal shut-in duration that leads to the largest return in production. Seeing these outcomes in the data we had would give us the ability to set an updated shut-in duration for each well factoring in the economics of production and personnel availability.
Ultimately, we want each well to be shut-in just long enough that it can unload its liquid and yield a high amount of production following restart. But we don’t want to shut-in any longer than needed, because that downtime is costly.

By implementing a slightly more robust data collection strategy in the field with increased collection periods, we feel confident that a dynamic optimization routine could be implemented that would continually determine the best shut-in duration for each well operating with manual interventions.
Finding #2: Chemical optimization may be achievable as well
As mentioned further above, there is chemical (foamers) being used in the field to help make liquid unloading in the wells easier. The data around chemical usage, however was just as scarce as the production data, if not worse. Despite this, we were able to find 34 out of ~100 wells that had consistent enough data entry on the chemical use that they could be used for further analytics.
Using the available data, we built machine learning models for each well and were able to use them for causal inference on how effective the chemical was in increasing production. The results were promising and indicated that out of the 34 wells, 19 were seemingly benefiting from the chemical use. Just as interesting, the remaining 15 wells were likely not benefiting, suggesting chemical could be stopped for those wells (an equally valuable finding).
Like we saw in the case of shut-ins, this early analysis indicated a strong potential for true optimization across the field that could lead to significant cost savings and increased production. The next step would be to dig deeper and understand variables such as ‘Put online date’, completion depth, field location, gas/liquid ratio, and other production variables that would help tell WHY we are observing the trends above. There is a story here somewhere…we just need to spend more time to find it. And, unfortunately, that may take more time (and more data) before the real benefits can be obtained.
How can we solve the data problem?
The sections above alluded to the possibility of optimizing various aspects of production. But what would we actually need to enable these solutions? Well, without getting into the IT-weeds of it, we fundamentally need more data. The granularity of data we’re working with isn’t enough to obtain the level of certainty in predictions that would be required to make true decisions on. Nor are we receiving data frequently enough that new optimized solutions could be produced at a fast enough time scale (monthly at a minimum, but weekly would be ideal) to adapt to the changing conditions.
To increase our access to data would require increased personnel in the field gathering it via the manual approach, or some kind of instrumentation. With technology advancements, we even think that edge devices could be in play here to help record data automatically and at more frequent intervals (at least hourly).
When the current strategy is manually maintained spreadsheets, everything else is on the table. But of course, all of those options do come with financial investments which is unfortunately the bottleneck right now.
Wrapping up
The experience with this project reveals just how widely variable operations in the energy industry can be. Multi-billion dollar projects leveraging state-of-the-art technology coexist with projects recording production information manually in spreadsheets. They are all collecting “data”, but access and getting the right data is not always the same.
But one thing is certain: the data collected is invaluable if we want to attempt optimizations that go beyond the manual “guess-and-check” approach. With it, we can begin to understand the behavior we observe and create optimized solutions about how we could operate better.
We are continuing to support this field. As investments are made in the data strategy for the field, we will look to further support optimization efforts. For now, we’ll keep calling this one a challenge because we certainly don’t think of it as a failure.


