Machine Learning for Real-time Hydrate Risk
Combining simulations, machine learning, and monitoring
Introduction
For most of 2023, we have been involved in an interesting project that brings our traditional domain knowledge to a non-traditional asset and showcases our unique problem solving ability, combing data and discipline to deploy an efficient real-time monitoring solution, saving our client >$100k USD as compared to a more traditional / legacy approach.
Our client is looking to increase the heating value of LNG (liquified natural gas) by injecting it with ethane prior to the liquifying stage. To accomplish this, the ethane will be blended at conditions where it is in liquid form with the natural gas stream. Through this blending process, the ethane will then be vaporized with the natural gas. Both the ethane and the natural gas streams are expected to be commercial quality and thus should have limited amounts of contaminants.
There was just one problem (well, actually quite a few “technical challenges", but only one that we are focused on here). The vaporization of the ethane will decrease temperatures quite a bit after the blending. The presence of any water in either of the streams presents a potential hydrate risk, with the risk varying depending on several factors that may change in real-time such as LNG/ethane blending ratio, operating temperatures/pressures, water content, and ambient air temperature.
Hydrates are a common production challenge, brought about with the combination of low temperatures / elevated pressures when light hydrocarbons are found in the presence of water.
Given the expected flow rates, the formation of hydrates was deemed to be something that should be avoided completely, as even small amounts of hydrate growth could easily escalate as additional reactants are continuously introduced into the system via more water and gas. Impact on production and LNG cargo delivery would have a significant commercial impact.
Hydrate risk
The formation of hydrates is a rather complex phenomena, but luckily is fairly well-studied and understood at this point. In most operational cases, the presence of water is in abundance so experiments have largely focused around understanding of hydrate growth with excess water. Where there is less certainty, however, is in the case of very low water content systems. In these conditions, water can be the limiting reactant to the hydrate formation, which increases the difficulty in predicting the exact formation conditions. Unfortunately, this is precisely the scenario of concern for this operation. Both the ethane and natural gas streams are expected to contain trace amounts of water, which can have a very dramatic impact on the potential hydrate risk.
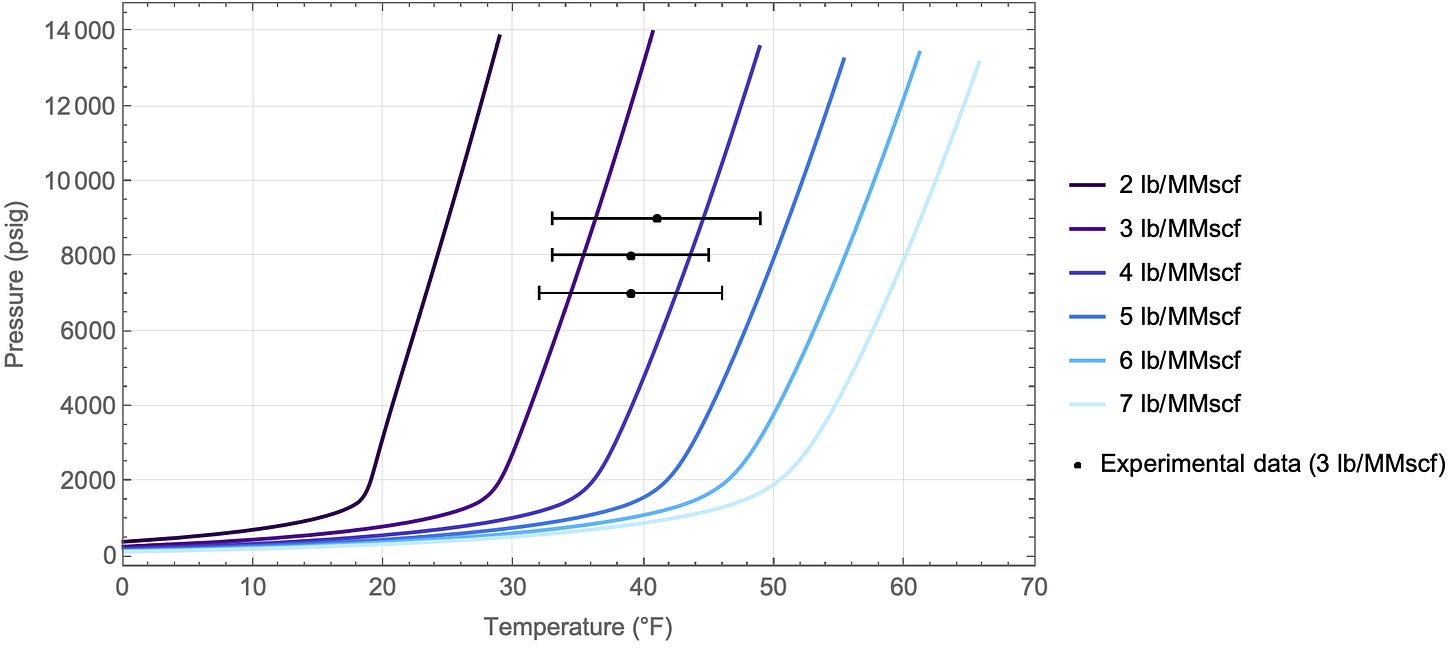
Our background in hydrates allowed us to generate formation conditions for a range of water cuts, but also layer in experimental data to assess the quality and accuracy of the hydrate model predictions. We were also able to assess the quality of the experimental data, assigning error bars due to the challenge in reproducibility of the experimental data.
We found that the model predictions were “close”, but that there could be a variance of 8-12°F between experimental and model results. As such, this uncertainty in the actual risk assessment (vs. the model predictions) needed to be accounted for. This also speaks to the need to understand that model results - while helpful - must always be considered in the context under which it was generated. We have all heard the phrase “garbage in = garbage out”, but in this case, the predictions were based on good data. However, understanding the limitations of the model’s foundational basis served to assign a confidence interval on what design margin should be applied.
Building a model
With a better understanding of how much uncertainty exists in the predicted hydrate conditions, further modeling (process simulations) could be undertaken to appropriately assess the field risk. Given the uncertainty in the hydrate prediction models, the field needs to carry an appropriate operating margin of an additional 8-12°F (vs. model). While applying design margin in the field is not unique, we had to be aware of uncertainty in both the predictions, as well as the actual operating conditions. In discussions with the client, the next obvious question that arose was “how can we monitor for this in the field in real-time?” In this case, the risk was changing quite dynamically.
The first step is taking the simulation model results and deploying within the client’s IT system, so that it is interfacing with the field data and updating values within the main operating dashboards, real-time. One approach would be to take the actual simulation engine and embed it, or alternatively use another version of software which is capable of this. The obvious issue here is how to accomplish this from an IT infrastructure perspective in a reasonable amount of time (and cost), not to mention the need to ensure the model is running 24/7, crash-free.
Our selected approach was very different. By first running a large parametric model (>100,000 simulations!) that contains a range of possible inputs based on the expected operating conditions, we can then produce a statistical-based model that captures that data instead of a more complicated physics-based approach. The statistics-based model can then be embedded into the company’s IT infrastructure in a much easier way than taking the entire simulation engine. The approach here worked since the process was “fixed” (i.e. it is built / operating, with a known process alignment), so that there was no need to have a full-blown process simulator running in real-time.
Of course, the obvious question at this point was what type of statistics-based model to use? One universal truth in statistics is that the simplest model is generally the best. But obviously in this case, accuracy trumps simplicity.
Our first approach was to try a linear regression model. The results of that model by typical accounts was good, but diving deeper shows that it wasn’t quite enough when you consider that a couple of predicted degrees on the hydrate margin can make a big difference to operations.
This also highlights the danger of curve-fitting, where R2 as close to 1.0 is the goal. To the untrained eye, this looks “pretty good” (R2 = 0.98). But, this fails to assess the true impact that the numerical variance will have on operational decisions. Lastly, this also speaks to the risk in plotting data to get a good (visual) fit over large abscissa/ordinate (X/Y-axes) ranges. By plotting a large enough data set (over a large enough range), data may be made to look good, when in reality, the variance in the parity plot suggests otherwise.
We experimented with adding additional complexity to better capture the simulation results before ultimately deciding to utilize a neural network. The final selected form of that neural network contained 3 different layers with a decreasing node count.
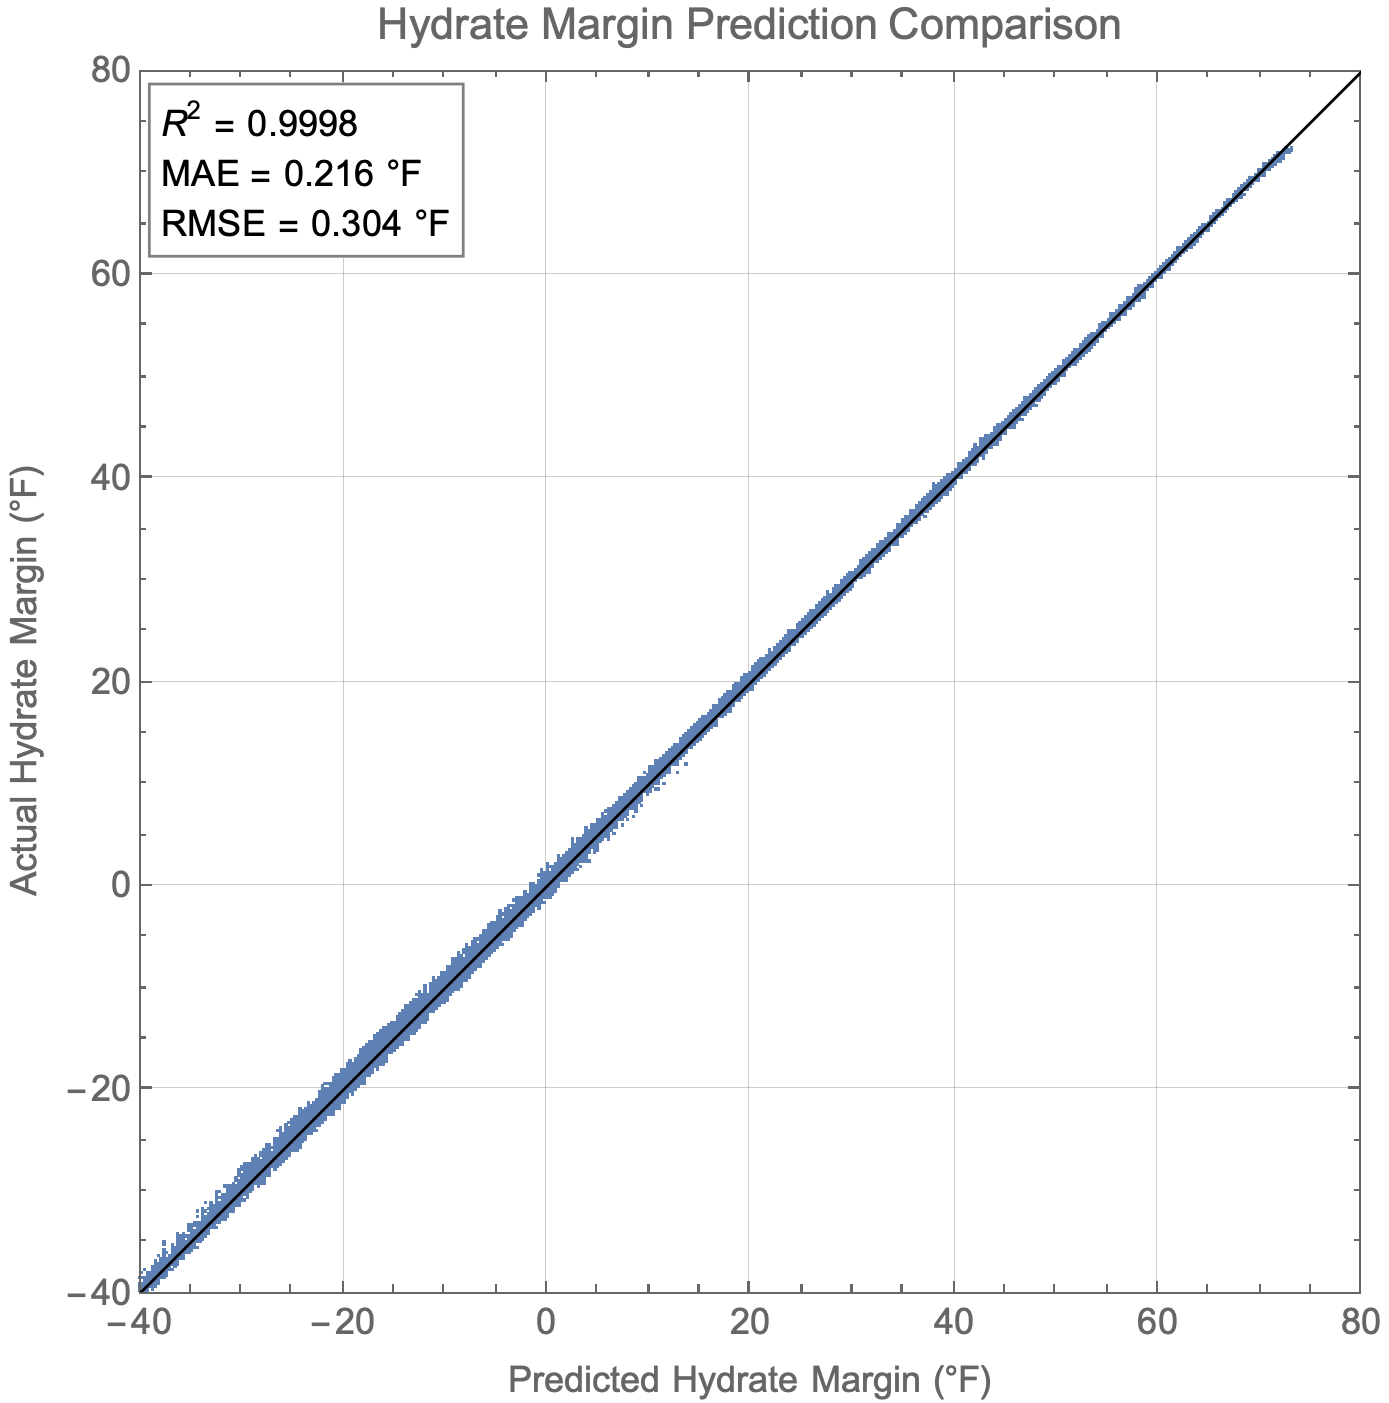
The results of the model were quite good, even after training on only a portion of the data and validating on the rest.
Implementing the model
Now that we had a highly accurate statistical model which could easily take the key inputs from conditions in the field and return back the predicted hydrate risk, the big question at this point was how could we embed this within the company’s infrastructure?
Luckily before electing to go with a neural network for the model, we discussed implementation and walked them through potential deployment options. Some options included creating web API’s, and some involved our own custom software. The idea we ultimately selected, in conjunction with their automation team, was to embed the model in a PLC (programmable logic controller). These PLC’s are relatively simple devices, but given that they have a certain amount of automation that can be programmed into them, it was possible for them to perform the math required to carry out the same instructions the neural network was performing. Being able to deploy a solution within the IT / operating environment that our clients work within is critical to the adoption and success of data-leveraged applications.
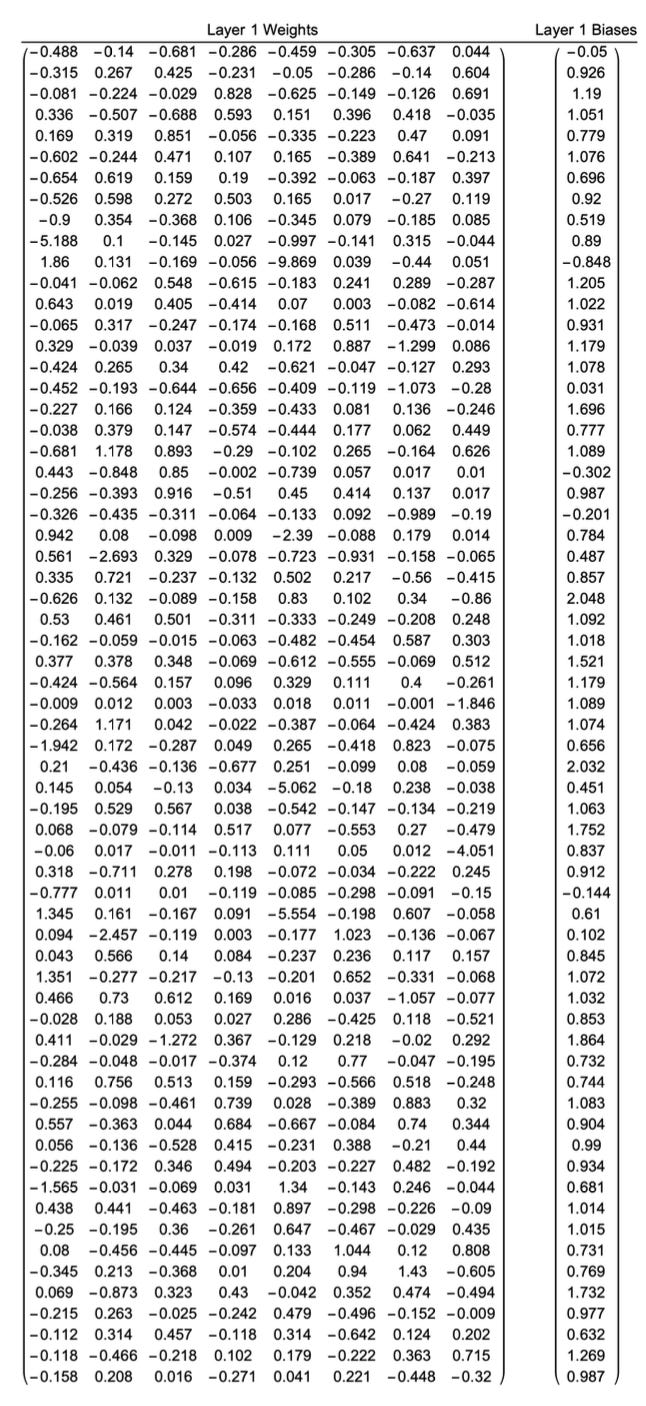
To accomplish this, we extracted the weights and biases from the various neural network layers and outlined the linear algebra operations required on the matrices. To our surprise from the automation team, everything we wanted to accomplish could be easily accessed. As such, we were able to deploy a neural network solution for the complex hydrate risk assessment without any new or complicated IT solution.
Final thoughts
This project is nearing commissioning now and our monitoring approach will be a key aspect of ensuring there is minimal risk to the entire process during everyday operation. We are excited to continue to be involved in this work and will get to see this novel solution in action.
This project truly encompasses everything that is possible at Pontem Analytics. The combination of deep domain knowledge with state-of-the-art data deployment approaches will uniquely unlock these kind of solutions, all deployable without an extensive system update to the existing IT network. We are excited to bring this kind of ingenuity to our clients and look forward to working on the next problem we face.
Be sure to check out our new website for Pontem Energy, which showcases more on about our areas of expertise.


