
Hydrate Curves - Finding the Balance Between Speed and Accuracy
MFL vs P2F Hydrate Curves


Engineers like to joke that mathematicians care too much about precision. “We’re engineers, not mathematicians”, is a line most of us have heard — or said — more than once. But in practice, engineering demands its own kind of precision.

When high CAPEX and OPEX decisions hinge on a few degrees or a few bars, every small deviation can carry real financial and operational consequences.
That said, not every situation calls for full-scale thermodynamic rigor. Sometimes, the goal is to get a quick, reliable estimate — something that gives engineers an immediate sense of hydrate risk without hours spent on setup or simulation. And that’s a trade-off we’ve been exploring over the past week: the balance between speed and accuracy in gas hydrate prediction tools.
Our work at Pontem Analytics often involves gas hydrate modelling as part of broader flow assurance and thermodynamic evaluations. During our ongoing work, we came across the p2f-hydratecalc, a Gas Hydrate Equilibrium Predictions Calculator, which is based on the Klauda-Sandler fugacity model (PR-SV equation of state) and HLS correlation, developed at the Phases to Flow Lab led by Professor Amadeu Sum at the Colorado School of Mines (CSM). Throughout this post, we will refer to it as P2F (short for Phases to Flow).
P2F is freely accessible online, offering anyone the chance to explore and experiment: https://p2f-hydratecalc.streamlit.app/
Given our strong academic and professional connections with CSM, and our shared enthusiasm for gas hydrate science, we saw an opportunity to benchmark P2F against the industry-standard Multiflash software, which we know first-hand has a very good match to lab-measured hydrate curves.
As a team of self-proclaimed hydrate nerds, we wanted to explore how this simplified, fast-running app performs compared to a full thermodynamic simulator across various fluids and inhibitor systems representative of real-world production conditions.

Basic Inhibitor Comparisons
The initial stage of the study focused on the simplest hydrate control systems — methanol, MEG, and salinity. These are the fundamental inhibitors used in field operations and serve as a clear benchmark for evaluating how the two software tools perform and compare. Starting with these single-inhibitor cases gave a solid baseline before introducing more complex combinations later on. It is also important to keep in mind that all hydrate system comparisons were evaluated using the CPA (Cubic-Plus-Association) and CPA + Electrolytes equations of state, for freshwater and saline systems, respectively, which have proven to be the most accurate EoS in the case of gas hydrates.
The comparison was carried out across three fluid systems:
a lean gas condensate
a rich gas condensate
and an STP gas flashed from an oil fluid
The choice of fluids was deliberate. We wanted to see how each model responds as the composition shifts from methane-dominant systems to those poorer in methane. Gas condensates represent lighter, more volatile fluids, while the oil, after being flashed to STP, introduces a higher percentage of C2-C5 into the mix.
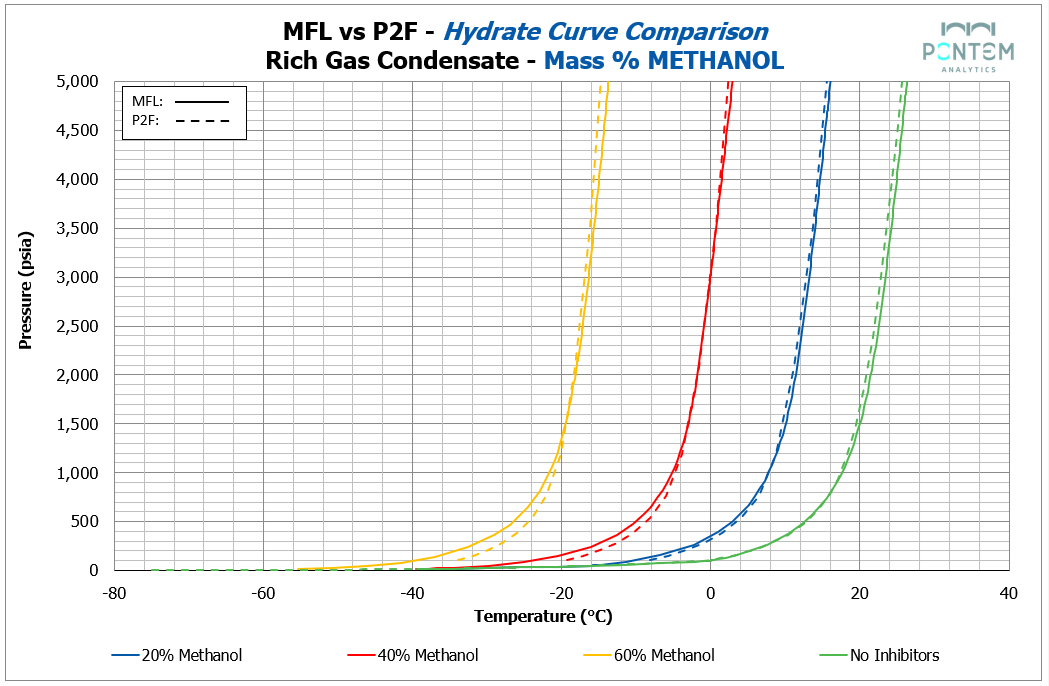
Hydrate Curves with Methanol
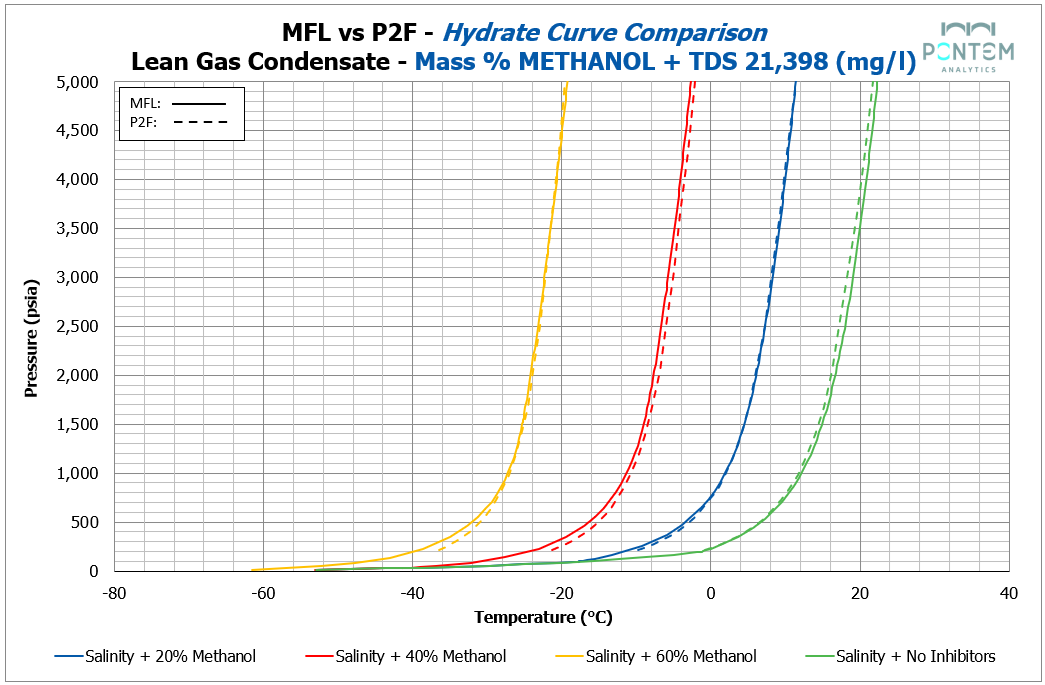
Across all fluids, methanol produced a strong level of agreement between Multiflash and P2F results.
For both lean and rich gas condensates, the hydrate curves were very much in agreement, with only minor negative deviations by P2F. The largest deviations appeared below 500 psi — corresponding to regions at the lower end of typical operating conditions.
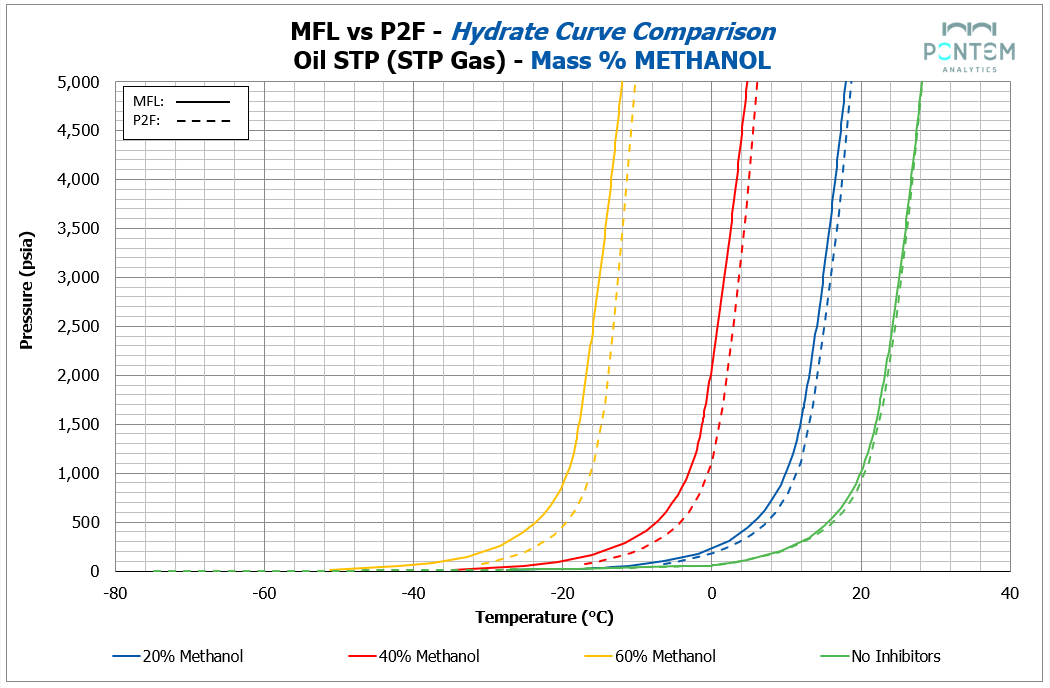
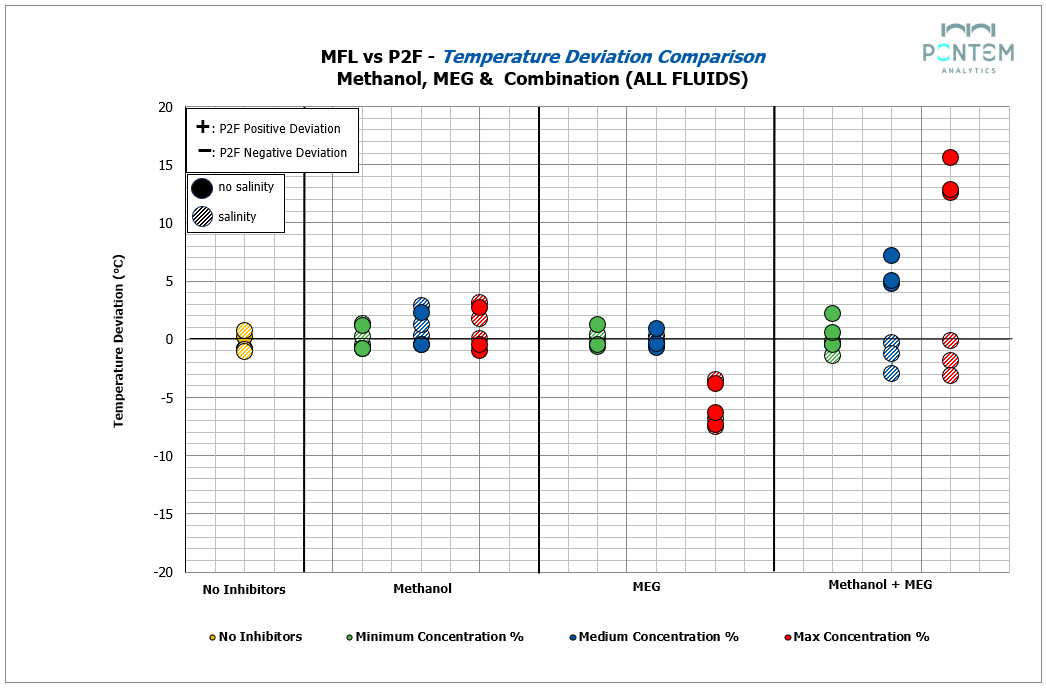
The STP gas from an oil fluid, however, showed slightly larger deviations, though remaining within the general range observed across systems. A consistent P2F positive deviation emerged across all methanol concentrations, with an average difference of ~2 °C between P2F and Multiflash results when the methanol is present. This phenomenon is briefly explored in the Theory Discussions section later on. In summary, we believe that this might be due to the way each package deals with gas and inhibitor solubility, as Multiflash, being the more robust of the two, accounts for that, hence why its curves are less conservative than P2F.
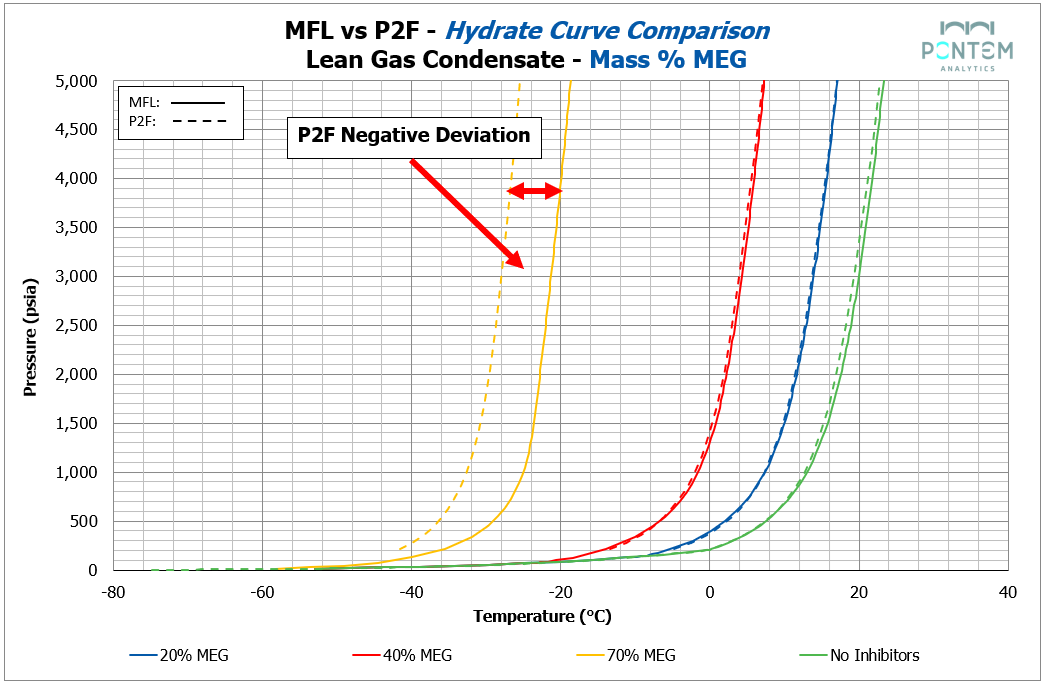
Hydrate Curves with MEG
MEG showed a similar story to MeOH in the lower to medium concentration range.
Across all fluids, the base, 20% and 40% inhibition levels showed an excellent match between Multiflash and P2F. The hydrate dissociation curves overlapped closely, indicating that for moderate glycol loadings, the simplified P2F model can produce thermodynamic behavior that greatly agrees with Multiflash.
Differences became noticeable only at the upper end of the inhibition range. At the maximum MEG concentration, P2F showed an average negative deviation of ~6 °C relative to Multiflash. While still capturing the overall curve shape, the magnitude of this deviation indicates that at higher glycol concentrations, non-ideal effects in the aqueous phase — represented differently across the two models — start to become more pronounced.
It is also possible that these effects are influenced by the extremely low temperatures associated with higher MEG inhibition levels. While these temperatures are low, they are still within the range routinely handled in MEG-based low-temperature separation systems.
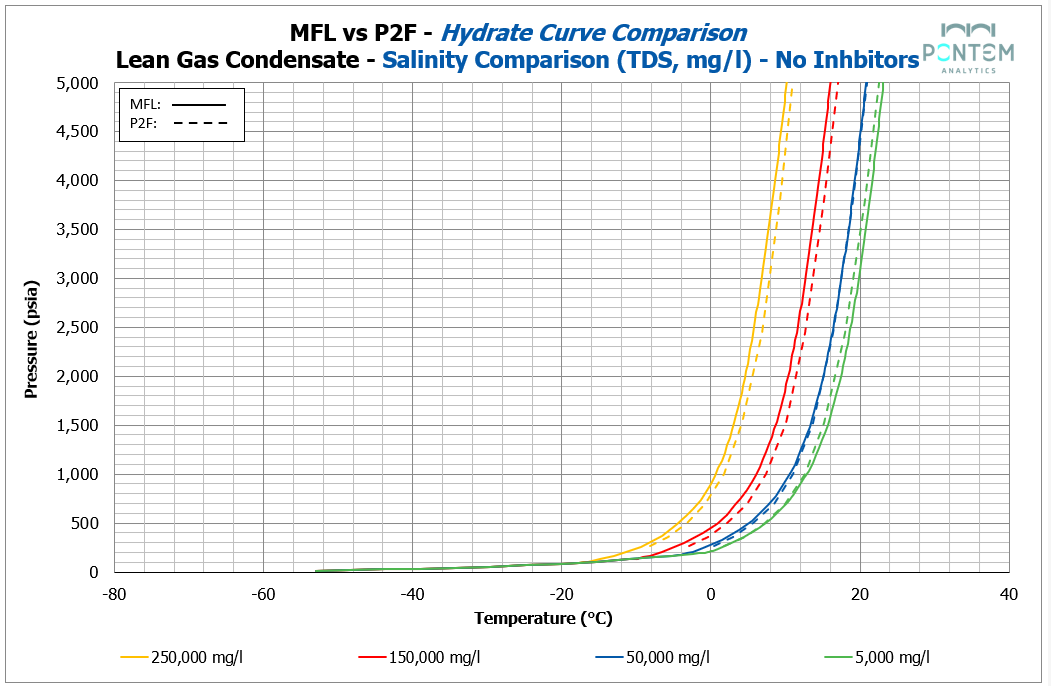
Hydrate Curves with Electrolytes (Salinity)
For better or for worse, formation water never comes as pure fresh water; salinity is always part of the picture. Before moving on to more advanced combinations, it was essential to first understand how both models respond to saline systems.
The comparison for a wide range of salinities showed near-perfect agreement across all fluids. Both Multiflash and P2F captured the expected shift in the hydrate equilibrium towards lower temperatures.
On average, deviations were within 0.7 °C, representing a small difference under typical operating conditions. This consistency provides confidence that both models can be used for base hydrate curve generation — cautiously, yet confidently — when dealing with typical formation water salinities.
Advanced Comparisons
Having explored the effects of individual inhibitors and salinity in isolation, it was time to move forward towards a more realistic field scenario — one where inhibitors interact with formation water rather than pure, deionized systems. This step also raises the modelling complexity, testing how each simulator handles overlapping inhibition mechanisms.
MEG or MeOH + Salinity
When salinity was introduced alongside methanol and MEG across all investigated fluids, the results revealed remarkably consistent trends. Both Multiflash and P2F reproduced the same relative behavior observed in the freshwater cases. The only noticeable shift came from the additional inhibition properties of salts, slightly lowering the hydrate curve temperature — a trend both models captured with precision.
In short, whether inhibitors were modelled in freshwater or saline environments, the consistency across all fluids reaffirms the robustness of the thermodynamic frameworks behind both tools.
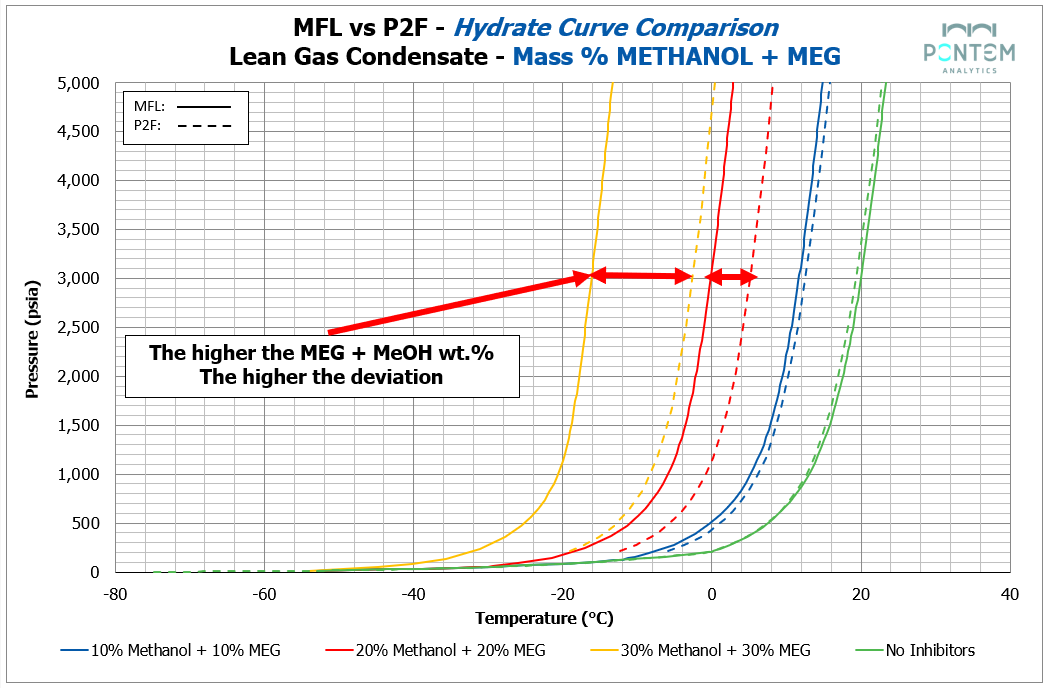
Unfortunately, the same cannot be said when methanol and MEG were combined. When two inhibitors were introduced into the system, the deviation between P2F and Multiflash increased, reflecting differences in how each model represents mixed inhibition mechanisms.
For the freshwater systems, a pronounced positive deviation trend emerged from P2F — the higher the combined inhibitor concentration, the greater the deviation. At maximum inhibitor concentration levels, the difference reached ~16 °C, representing a deviation magnitude larger than typically observed in hydrate curve modelling.
With that said, however, it is important to keep in mind that under very rare circumstances will the two inhibitors be combined. If both solvents are to be used, they are usually injected at different times across the lifetime of the operation. Even so, it can still sometimes be the case, and it is therefore worth having a look at how the two systems compare under these solvent conditions.
When the same mixtures were tested in saline systems, the deviations decreased substantially. Here, P2F showed a modest negative deviation trend, with deviations around ~3 °C. This pattern may indicate that ion–inhibitor interactions influence the model’s thermodynamic behavior.
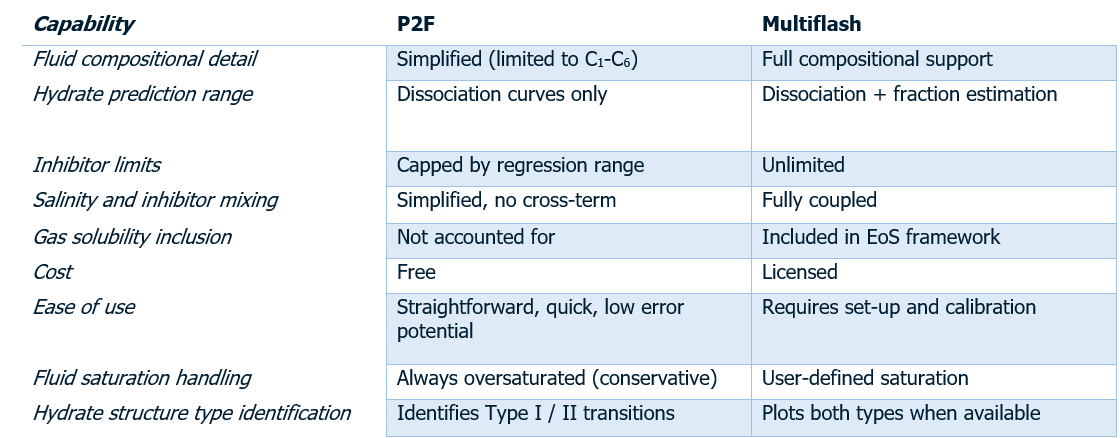
Comparison Summary (MFL vs P2F)
In summary, P2F provides a balance between simplicity and predictive accuracy, whereas tools like Multiflash provide additional modelling flexibility — particularly for more detailed hydrate studies.
Theory Discussions
The Hu–Lee–Sum (HLS) correlation used in P2F performs well given its simplicity; several theoretical and methodological limitations remain, many of which are acknowledged by its authors. Understanding these is crucial for interpreting its results and improving the tool.
Cross-Interaction Simplification Between Salts and Organics
One of the key simplifications in the HLS model is how it treats salts and organic inhibitors separately. Their contributions to water activity are simply summed
(ln aw_salt + ln aw_organic). This assumes that cross-interaction effects between ions and organic molecules are negligible.
Suggested Improvement: Introduce a cross-interaction correction term (fitted parameter derived from mixed brine + THI datasets). This retains the simplicity of the algebraic form but captures non-ideal behavior in real-world mixtures more faithfully.
Gas Solubility Effects Not Explicitly Included
Gases like CO₂ and H₂S dissolve significantly in water and alter the water activity — an effect the current HLS formulation does not explicitly account for. As a result, the model tends to show larger deviations in acid-gas–rich systems.
Suggested Improvement: Include a gas solubility correction term that would extend HLS applicability into CO₂ and H₂S bearing systems without resorting to full van der Waals–Platteeuw complexity.
The following references were used in the investigation of the Hu–Lee–Sum (HLS) correlation:
1. Kunneman, K. & Sum, A. K. (2025) p2f-hydratecalc: A Web Python-Based Tool for the Prediction of Natural Gas Hydrate Equilibrium and Inhibition, SoftwareX, 32, 102422. https://doi.org/10.1016/j.softx.2025.102422
Hu, Y., Sa, J.-H., Lee, B. R., & Sum, A. K. (2018). Universal correlation for gas hydrates suppression temperature of inhibited systems: III. Salts and organic inhibitors. AIChE Journal, 64(11), 4097–4109. https://doi.org/10.1002/aic.16369
Zhang, X., Vijayamohan, P., Hu, Y., Sum, A. K., & Subramanian, S. (2020). Gas hydrates phase equilibria for brine blends: Measurements and comparison with prediction models. Fluid Phase Equilibria, 521, 112688. https://doi.org/10.1016/j.fluid.2020.112688
Looking Ahead
P2F is notable for its accessibility — free, simple, and fast — providing an efficient route to hydrate prediction while reducing opportunities for manual error. In practice, that means engineers can move from concept to insight in minutes, without the overhead of configuring complex thermodynamic models.
But this isn’t where the story ends. We’re already exploring ways to embed this capability into our own digital workflows, integrating a quick hydrate-screening method for flow assurance solutions:
Integrating Fast Hydrate Tools: Turn academic hydrate models like P2F into practical field tools through smart integration with live data systems.
Real-Time Field Monitoring: Connect P2F to live platform data (temperature, pressure, salinity, inhibitor concentration) to calculate hydrate risk instantly — visualized as green/yellow/red status with no manual input.
Smart Inhibitor Dosing: Automatically adjust inhibitor injection within set limits when hydrate risk increases — minimizing overuse, cutting costs, and maintaining safety.
Transient Event Monitoring: During operations like start-up or pigging, P2F recalculates hydrate risk continuously, adapting dosing in real time and managing transient risks predictively.
Fleet-Wide Risk Dashboard: Aggregate live data from multiple platforms into a central heat map to identify hydrate risk trends, prioritize interventions, and shift from reactive to predictive management.
Predictive Scenario Simulation: Run “what-if” analyses for planned operations (e.g., pig runs or flow changes) to forecast hydrate risk and recommend proactive measures before execution.
Closing Remarks
In summary, P2F, powered by the HLS model, is an accurate, fast, and user-friendly solution for most practical hydrate assessments. However, Multiflash remains the more flexible, fully thermodynamic platform, capable of handling and designing complex systems. Overall, when compared, both tools generally show an excellent match within a reasonable deviation margin.
Together, they represent the trade-off between speed and precision — and understanding that balance allows engineers to choose the right tool for the right task.
The goal isn’t to replace comprehensive simulators like Multiflash — it’s to complement them, providing a first-pass diagnostic layer that helps identify hydrate risks early and intuitively.
Discussions are also underway with Dr. Sum and his team at the Colorado School of Mines to explore potential collaborations that could enhance both the thermodynamic model and its integration into field-ready applications. It’s an exciting opportunity to bridge academic precision with operational practicality — and keep pushing hydrate modelling towards tools that are smarter, faster, and built for engineers.