
Flowing Uphill in Tanzania
Uhakika wa Mtiririko ("Flow Assurance")

Jambo! Mambo? Poa…Poa Kuku! (When you spend a few weeks in Tanzania, you pick up a little Swahili along the way). This trip will take us from -2500m below sea level to +6000m above sea level, a distance nearly as tall as Mt. Everest. But, in Africa, there really is only one big mountain of interest….
Physics first, recess second.
How it Started
Back in a previous life (2017), several of us launched one of our international offices by gathering at the BHR Multiphase Flow Conference in Cannes, France. Conferences can be rough sometimes. Very in-depth technical conferences can be rougher. But, spending a week in the French Riviera is a good way to soften the blow.
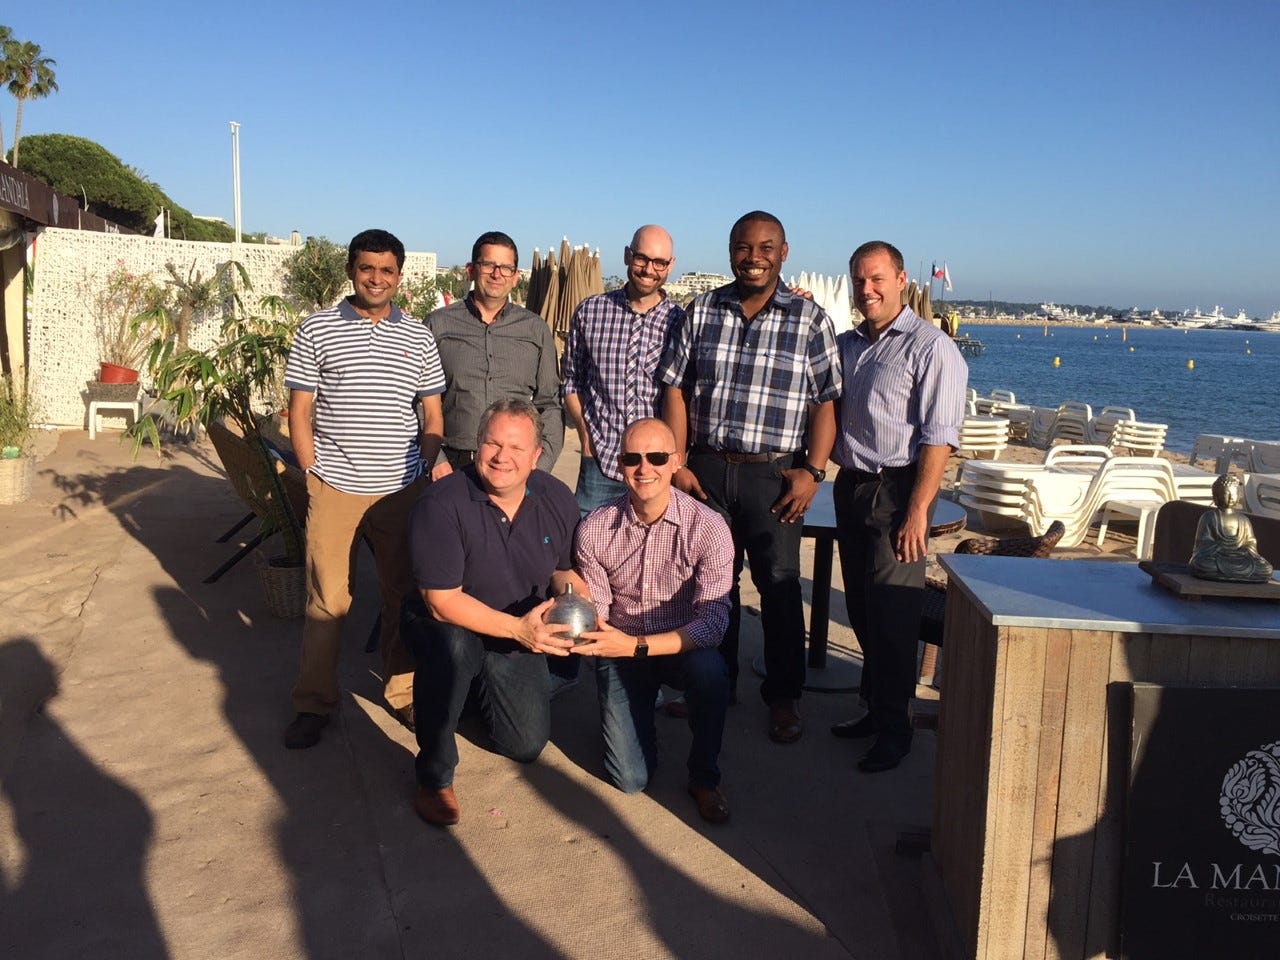
Current Pontem Analytics colleagues Temitope Solanke and Ian Kopperman (both pictured above) delivered a paper on Floating LNG (FLNG). However - despite their eloquent talk - the highlight of the conference was a Special Regional Focus section on Tanzania and Statoil’s large gas discoveries. As of 2024, there is estimated >55 TCF of recoverable natural gas reserves off the southern coast of Tanzania, north of other known discoveries in neighboring Mozambique.

Specific to the Statoil discovery, it was challenged by:
>2000 m water depth
>100 km tieback distance (to shore)
Steep, near-shore inclination (20-30°)…we will come back to this later with much more aggressive inclinations (40-50°+) in Tanzania!
While not unique in terms of other developments (i.e. similar challenges to Ormen Lange, Snøhvit, etc.), specific effort was put into the Tanzania discovery to understand the impact of liquid loading in the multiphase production lines. Understanding the behavior helped to identify not only the liquid content (condensate / MEG) in the pipeline to properly size onshore handling facilities, but also the impact on pressure drop to properly characterize the deliverability and recoverable reserves of the asset.
Statoil, in collaboration with SINTEF / Schlumberger, initiated several multiphase flow studies to better understand the pressure drop in these low liquid (i.e. low condensate yield) gas reservoirs. Building on previous work (BHR, 2015) which focused on liquid accumulation, the 2017 work on the Tanzania project focused addressing the following:
Frictional pressure drop increases significantly with higher water fractions
Existing hydraulic models severely under-predict frictional pressure drop at high water fractions
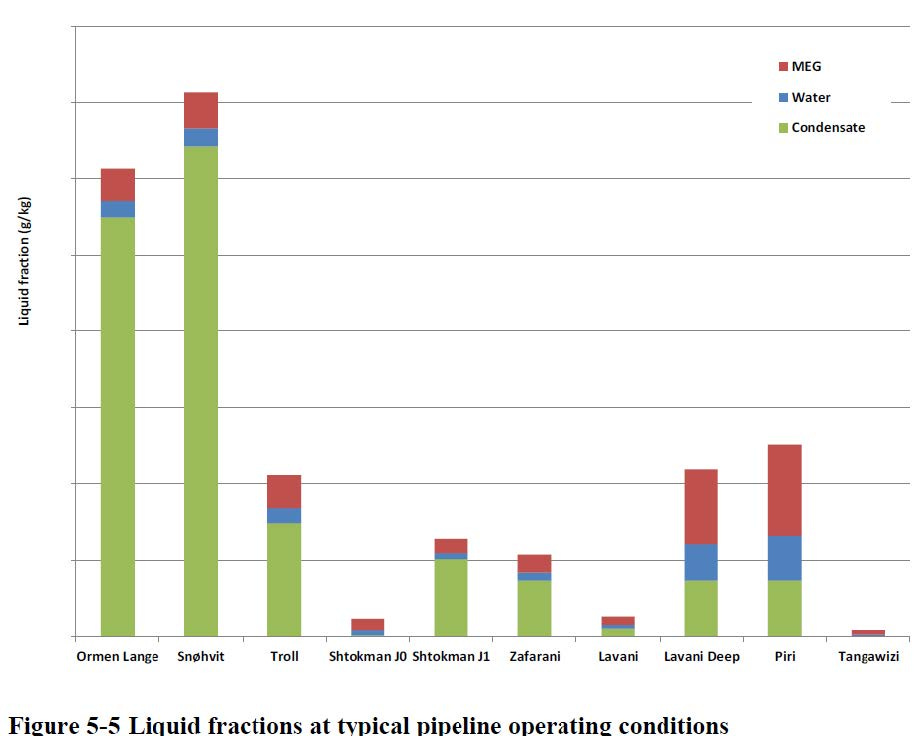
Low liquid loading (generally defined by low condensate/gas ratio, CGR) and the impact of high water fractions is inter-related, as the lower CGR fluids are more susceptible to high water cuts (for a similar water volumetric rate). A snapshot of the Tanzania fluids, as taken from the published BHR work, is shown below (and relative to other known fluids on the left)
Flow Assurance in High Definition (HD)
Previous OLGA modeling has been shown to have several weaknesses for low liquid loading and steep inclinations, hence the development of the improved OLGAHD model (BHR-2017-439), which has now become a ‘standard operating procedure’ for modeling gas/condensate systems, particularly with respect to liquid holdup. However, the experimental work at SINTEF suggested the following when it comes to pressure drop:
OLGAHD under-predicts frictional pressure drop in horizontal, three-phase flow at high water cuts.
OLGA model over-predicts frictional pressure drop in vertical, three-phase flow at high water cuts.
Additional modifications to the OLGA code - as supported by the SINTEF flow experiments - were developed, focusing primarily on capturing the effect of thin liquid films on pipe walls and their contribution to increased friction, namely:
Increased frictional pressure drop is believed to largely depend on the roughness of the film on the pipe wall.
Liquid mixture may have a relatively high effective viscosity (particularly when considering the presence of MEG for hydrate inhibition), increasing the film thickness and, hence, the equivalent roughness.

OLGA Versions: A Comparison
One of the challenges with improved models is when to make the switch. This becomes complicated on legacy projects where early engineering work (and decisions made) with one model…if the new model is “better”, does that mean we should switch? What if it gives more (or less) conservative answers? How do you properly risk-weight this into your decision framework?
In a subsequent article, we will dive further into the equations arising from the Statoil / BHR papers and how they directly translate into pressure drop (dP). For now, we simply show the case studies for two field comparisons, both low liquid loaded gas/condensate fields, and how the different OLGA versions compare.
Comparison #1
First field is a low CGR fluid, long-distance tieback inhibited with MEG. We see that the later versions of OLGA predict higher pressure drops in the friction-dominated regime (>300 MMscfd), with some downward correction in the latest v2025 (vs 2021). In all cases, the pressure drops are higher than the v2017 and earlier vintages (pre-OLGAHD).
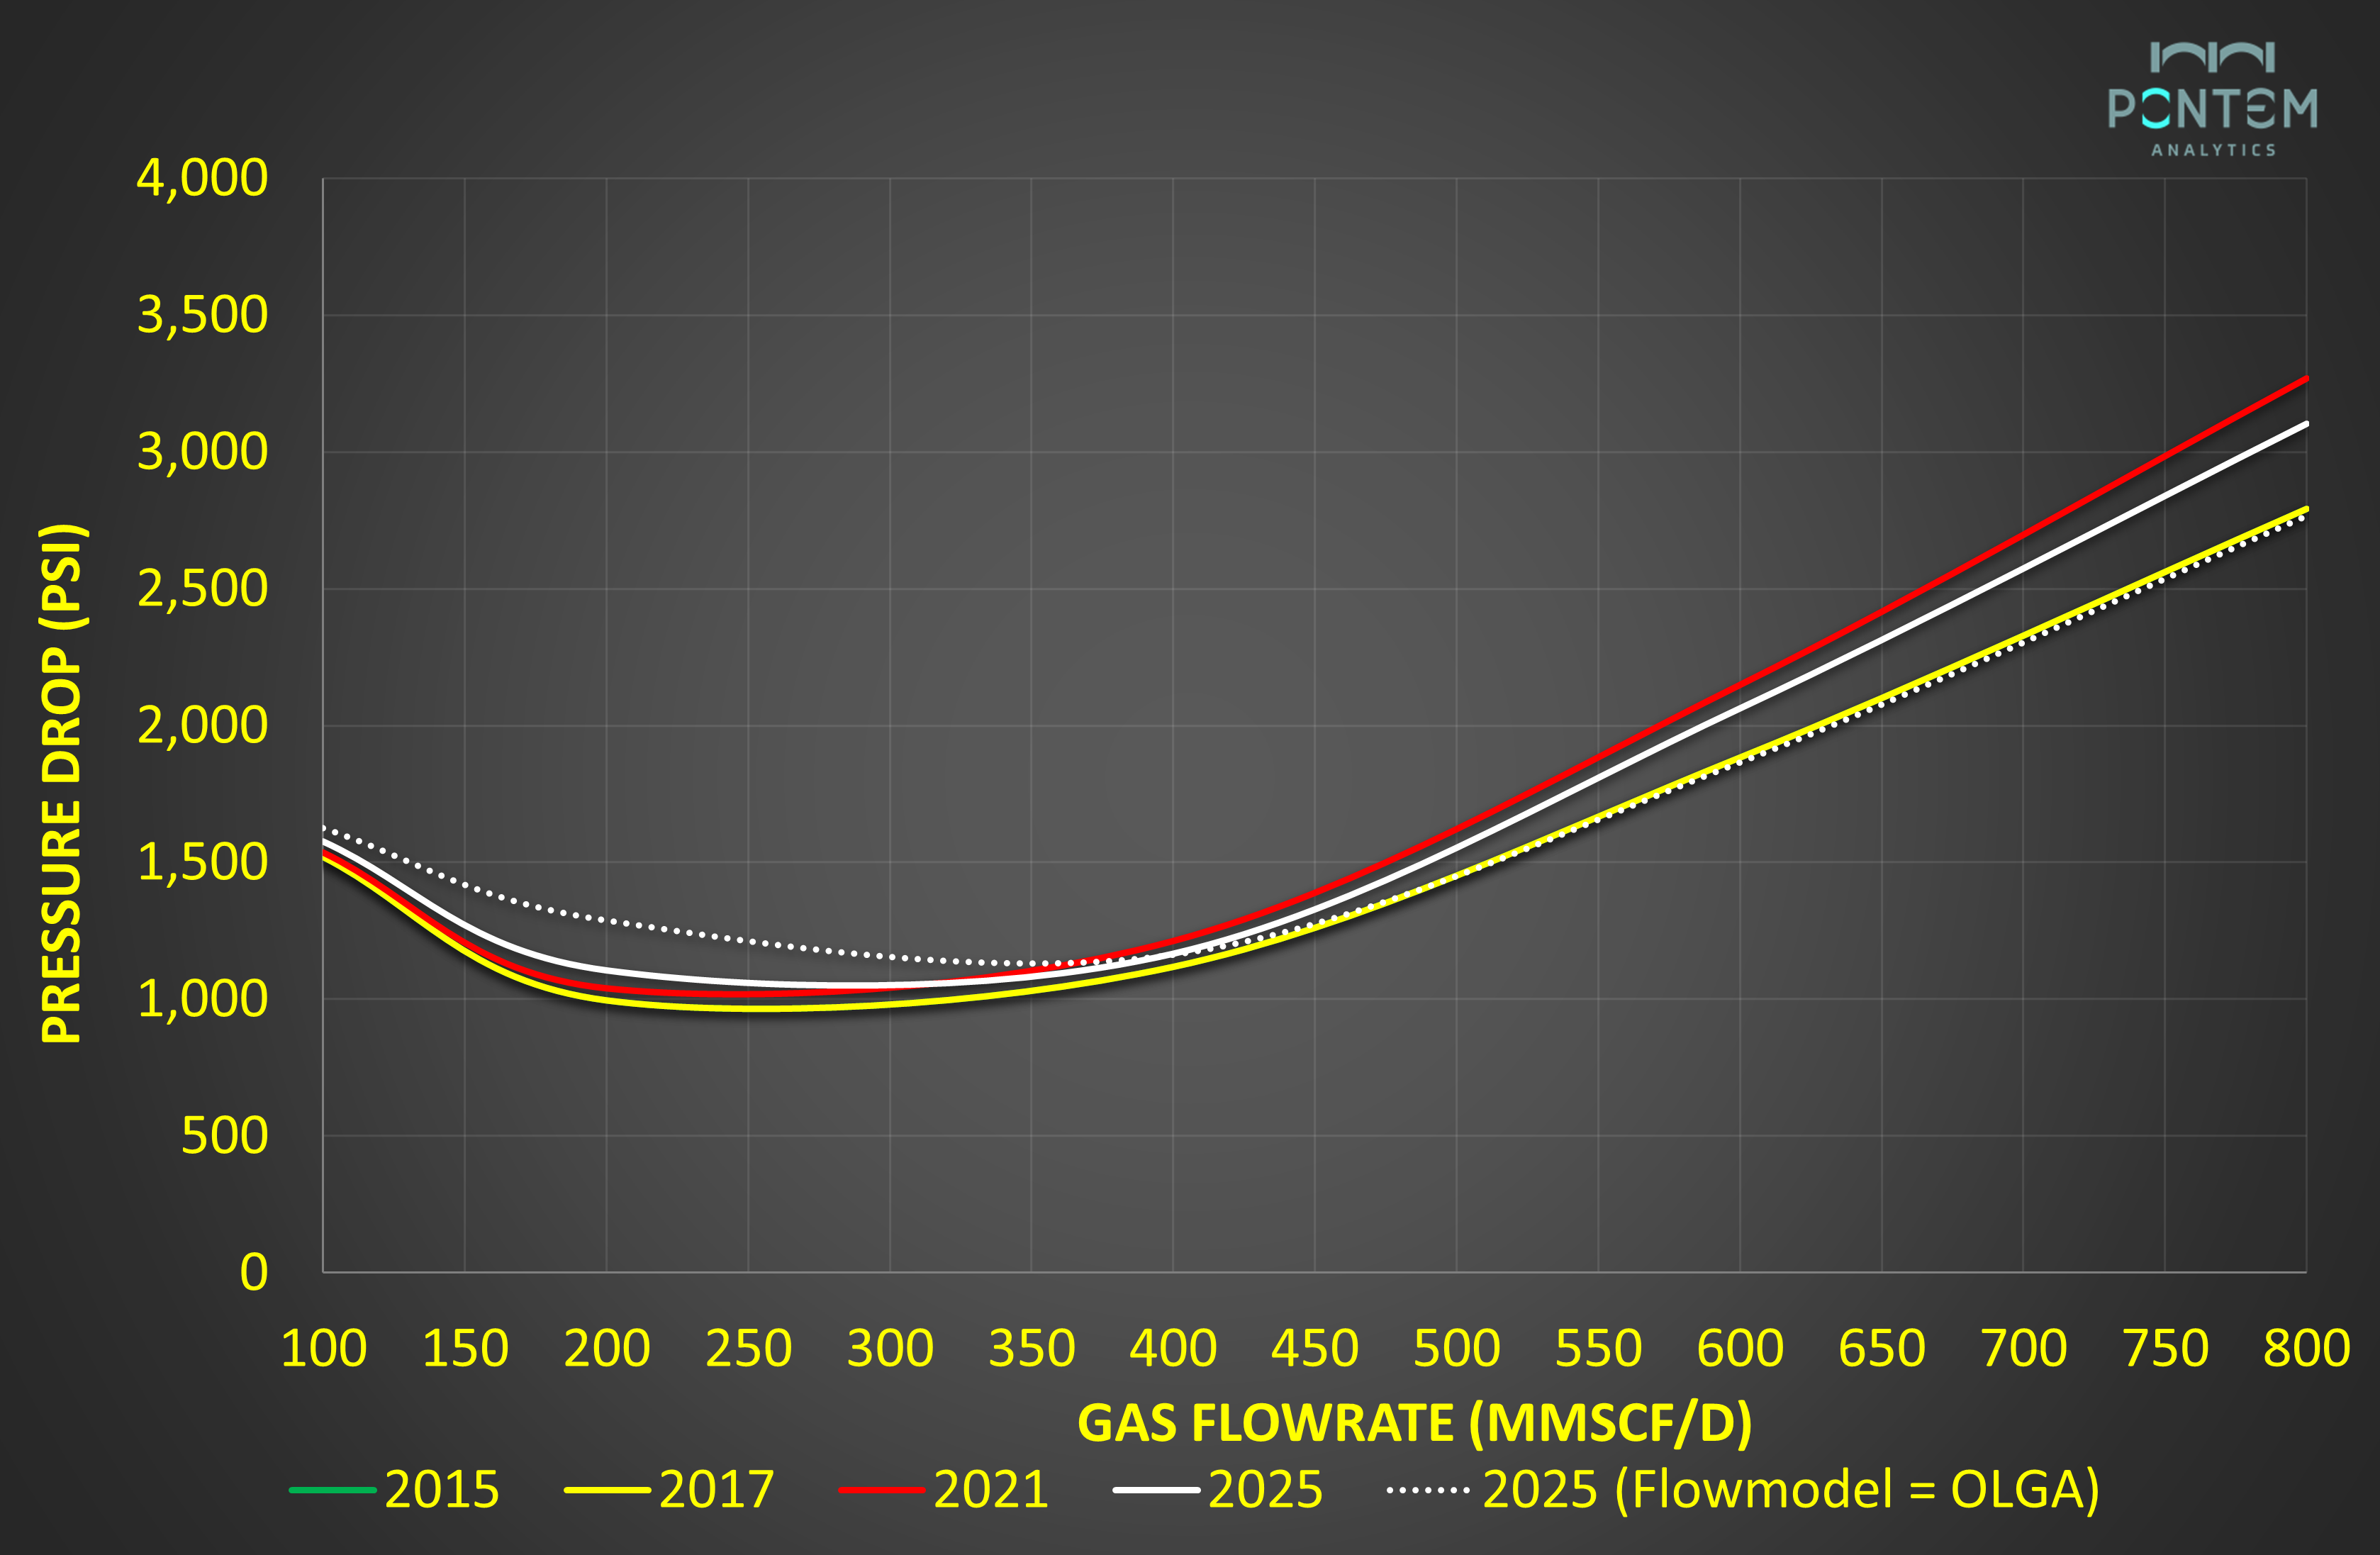
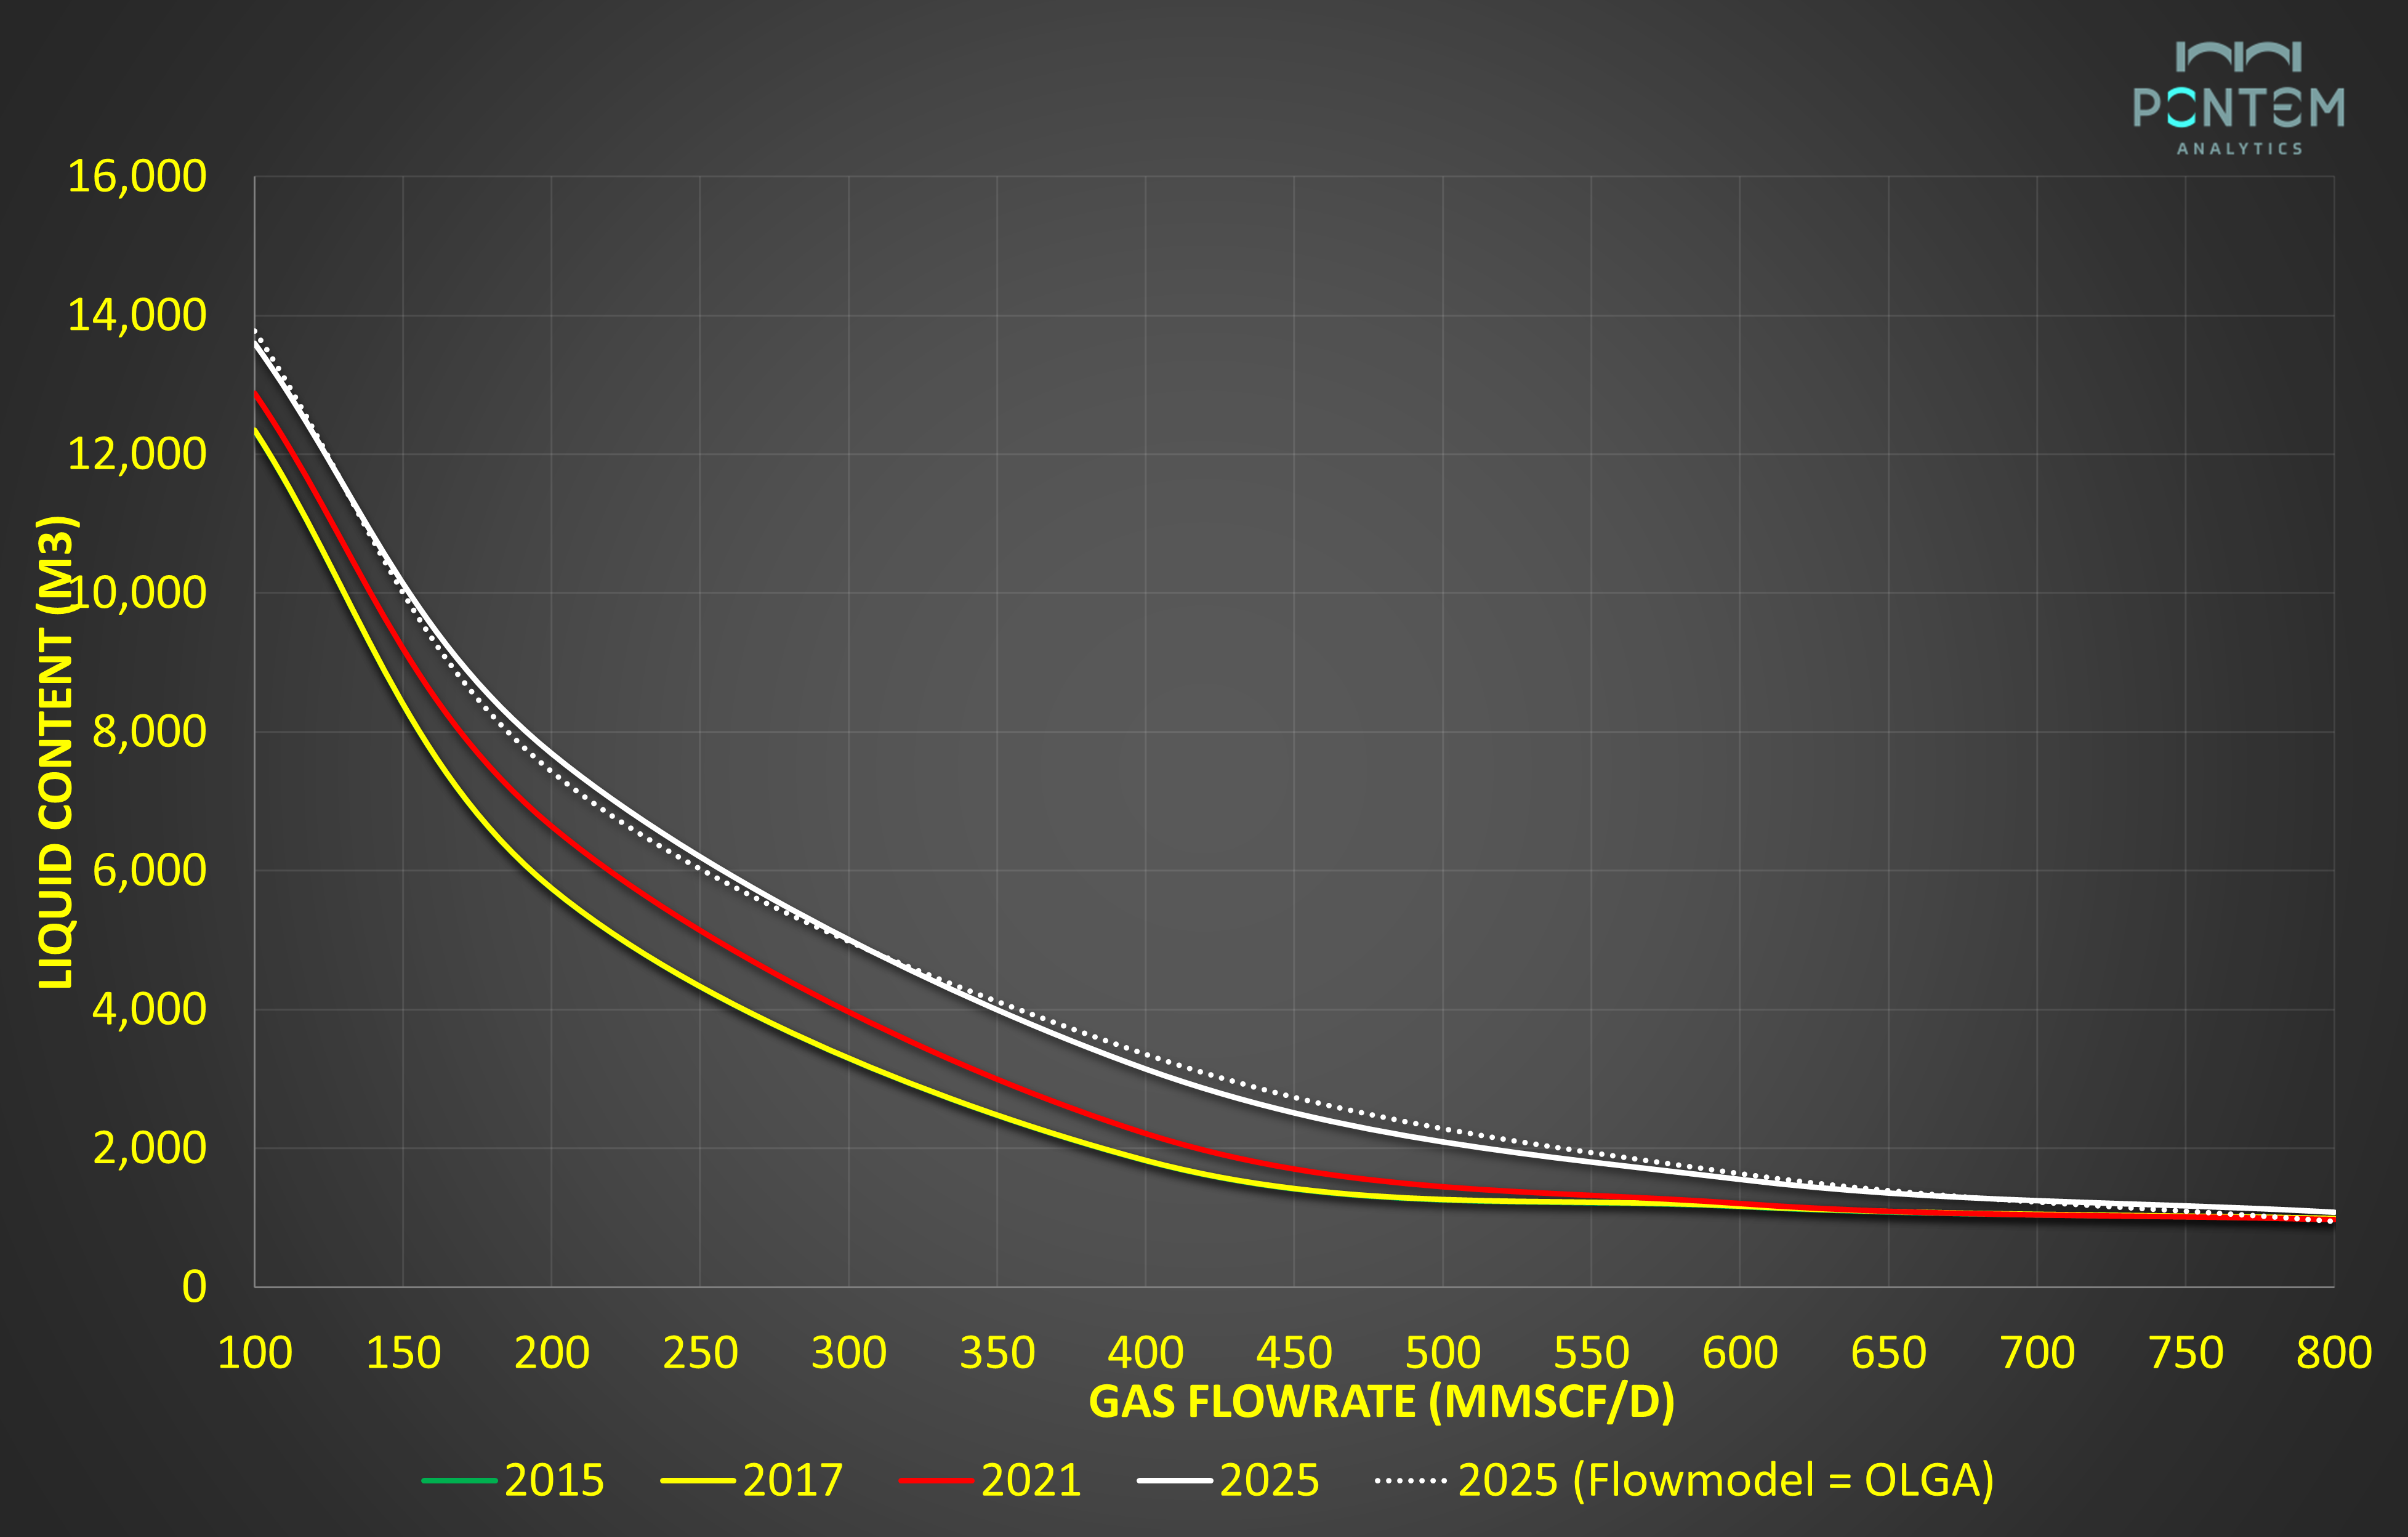
With resect to liquid holdup, we found v2025 to give higher holdups (vs v2021) in the hydrostatic-dominated region, which in this case is nearly entirely aqueous phase (water / MEG). Note the “Flowmodel = OLGA” cases were the non-OLGAHD options, which showed a more ‘extreme’ prediction in both pressure drop and liquid holdup. While the differences look small, the spread can be quite large in actual terms (i.e. 200 MMscfd: ~2000³ vs. 4000m³, or 12,500 bbl vs. 25,000 bbl liquid inventory, 2X factor)

Comparison #2
Similar comparison was done for a slightly richer fluid (higher CGR), but with lower relative water cuts. In these cases, there is less spread between the OLGAHD and non-HD (“Flowmodel = OLGA”). This makes sense, as the model improvements tended to focus on corrections in the high water cut region. We also see a similar divergence between the models at higher flowrates (higher friction losses), with v2025 predicting lower dP vs. v 2021.

We see similar trends on the liquid holdup, with later versions predicting higher liquid accumulation in the hydrostatic-dominated region, with an almost sequential step-up in volumes with each new version of OLGA.
It is difficult to make an absolute determination on which version should be used, but our experience suggests that with each new release, the models are more closely approximating field data. The newly-released v2025 does show some differences vs. previous versions (v2021), so this would be good to highlight across Schlumberger’s user group community to see what other fields have observed (and how this compares to field data).
Future posts will dive into some field-data comparisons and show how the models were corrected (i.e. adjusted roughness) to match, with a reduced need to aggressively tune the models with later versions of OLGA. This highlights the improved nature of the multiphase flow predictions facilitated by the SINTEF measurements arising from the Tanzania project experiences (and others).
I bless the rains down in Africa
Gonna take some time to do the things we never had (Toto - Africa)
Roof of Africa: Climbing The Hill
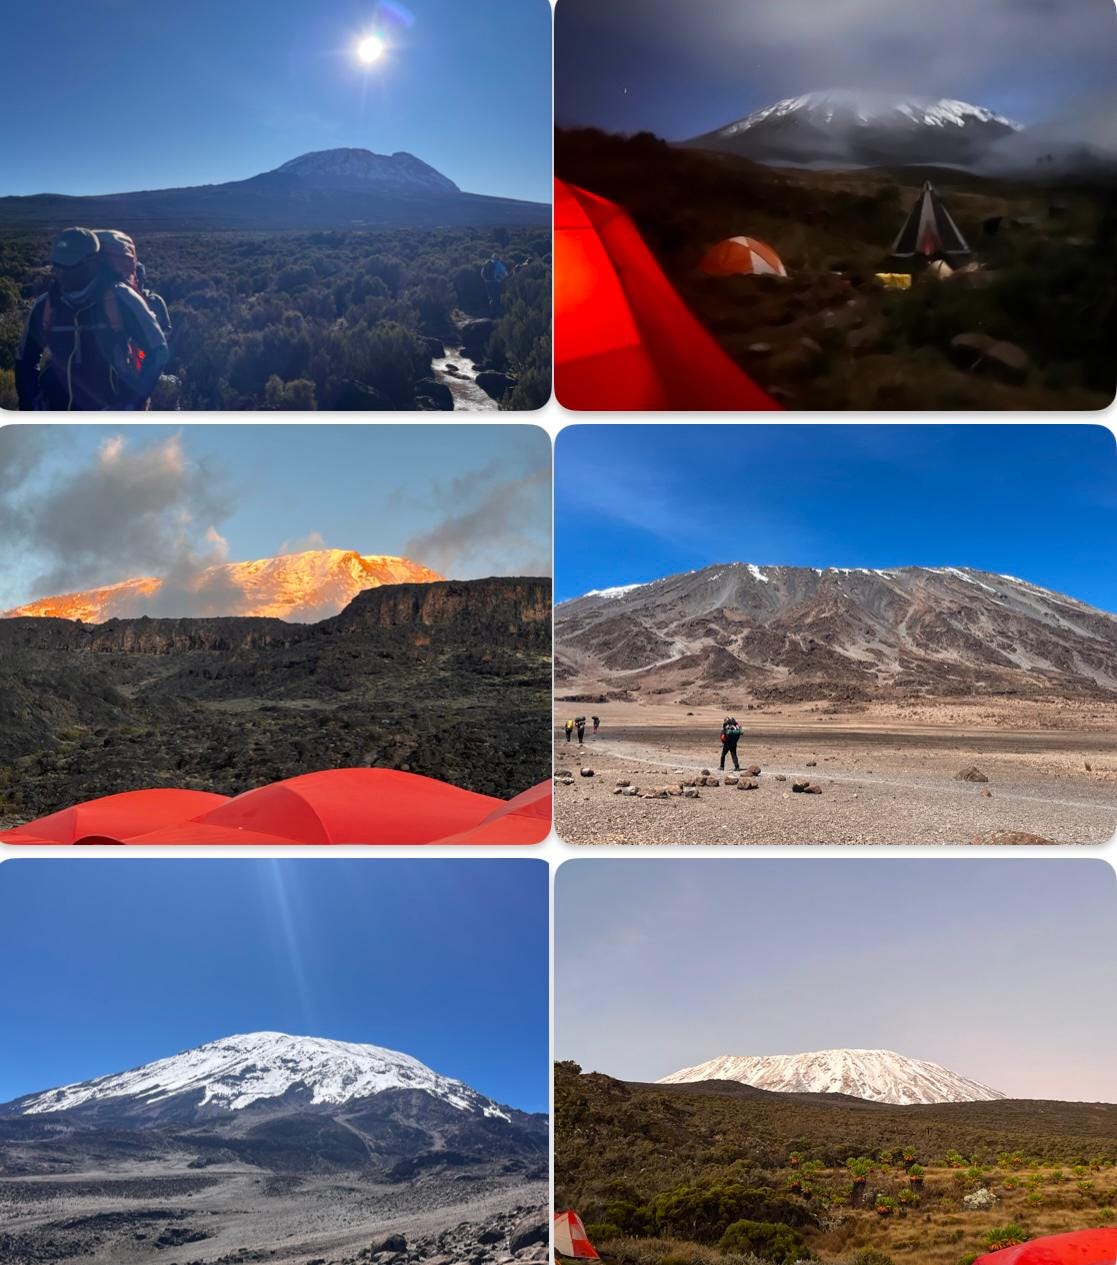
Switching gears from sub sea to terra firma Tanzania. If you have read this far, you are either (a) very patient to get to the fun stuff or (b) a multiphase flow enthusiast…not sure if that unicorn exists who is actually “both”. So, without further ado, we give you Tanzania’s very own Mt Kilimanjaro, the highest free-standing mountain in the world and the subject conquest of yours truly. And what would a Pontem post be without data, so we captured some unique insights too.

Why climb Kilimanjaro? No, it’s not part of some mid-life crisis, bucket list, prove a point, or fantasy football punishment. Rather, I think it’s my mother’s constant use of the John F. Kenney quote about why the US went to the moon (tl;dr “because its hard”):
We choose to go to the moon in this decade and do the other things, not because they are easy, but because they are hard, because that goal will serve to organize and measure the best of our energies and skills, because that challenge is one that we are willing to accept, one we are unwilling to postpone, and one which we intend to win, and the others, too (JFK)
What makes Kilimanjaro so unique is not only its prominence within the landscape, but its daunting elevation (~6000m, without oxygen) and different climates up this dormant volcano. A longer trek offers the most chance to acclimate to the changing conditions, which we discuss below, but also the longest exposure to the elements.
Over the course of the 10-day summit ascent, all four seasons were encountered with a combination of heat waves (it’s summer, after all), torrential downpours, and snow storms.
Sub Sea vs. Above Sea
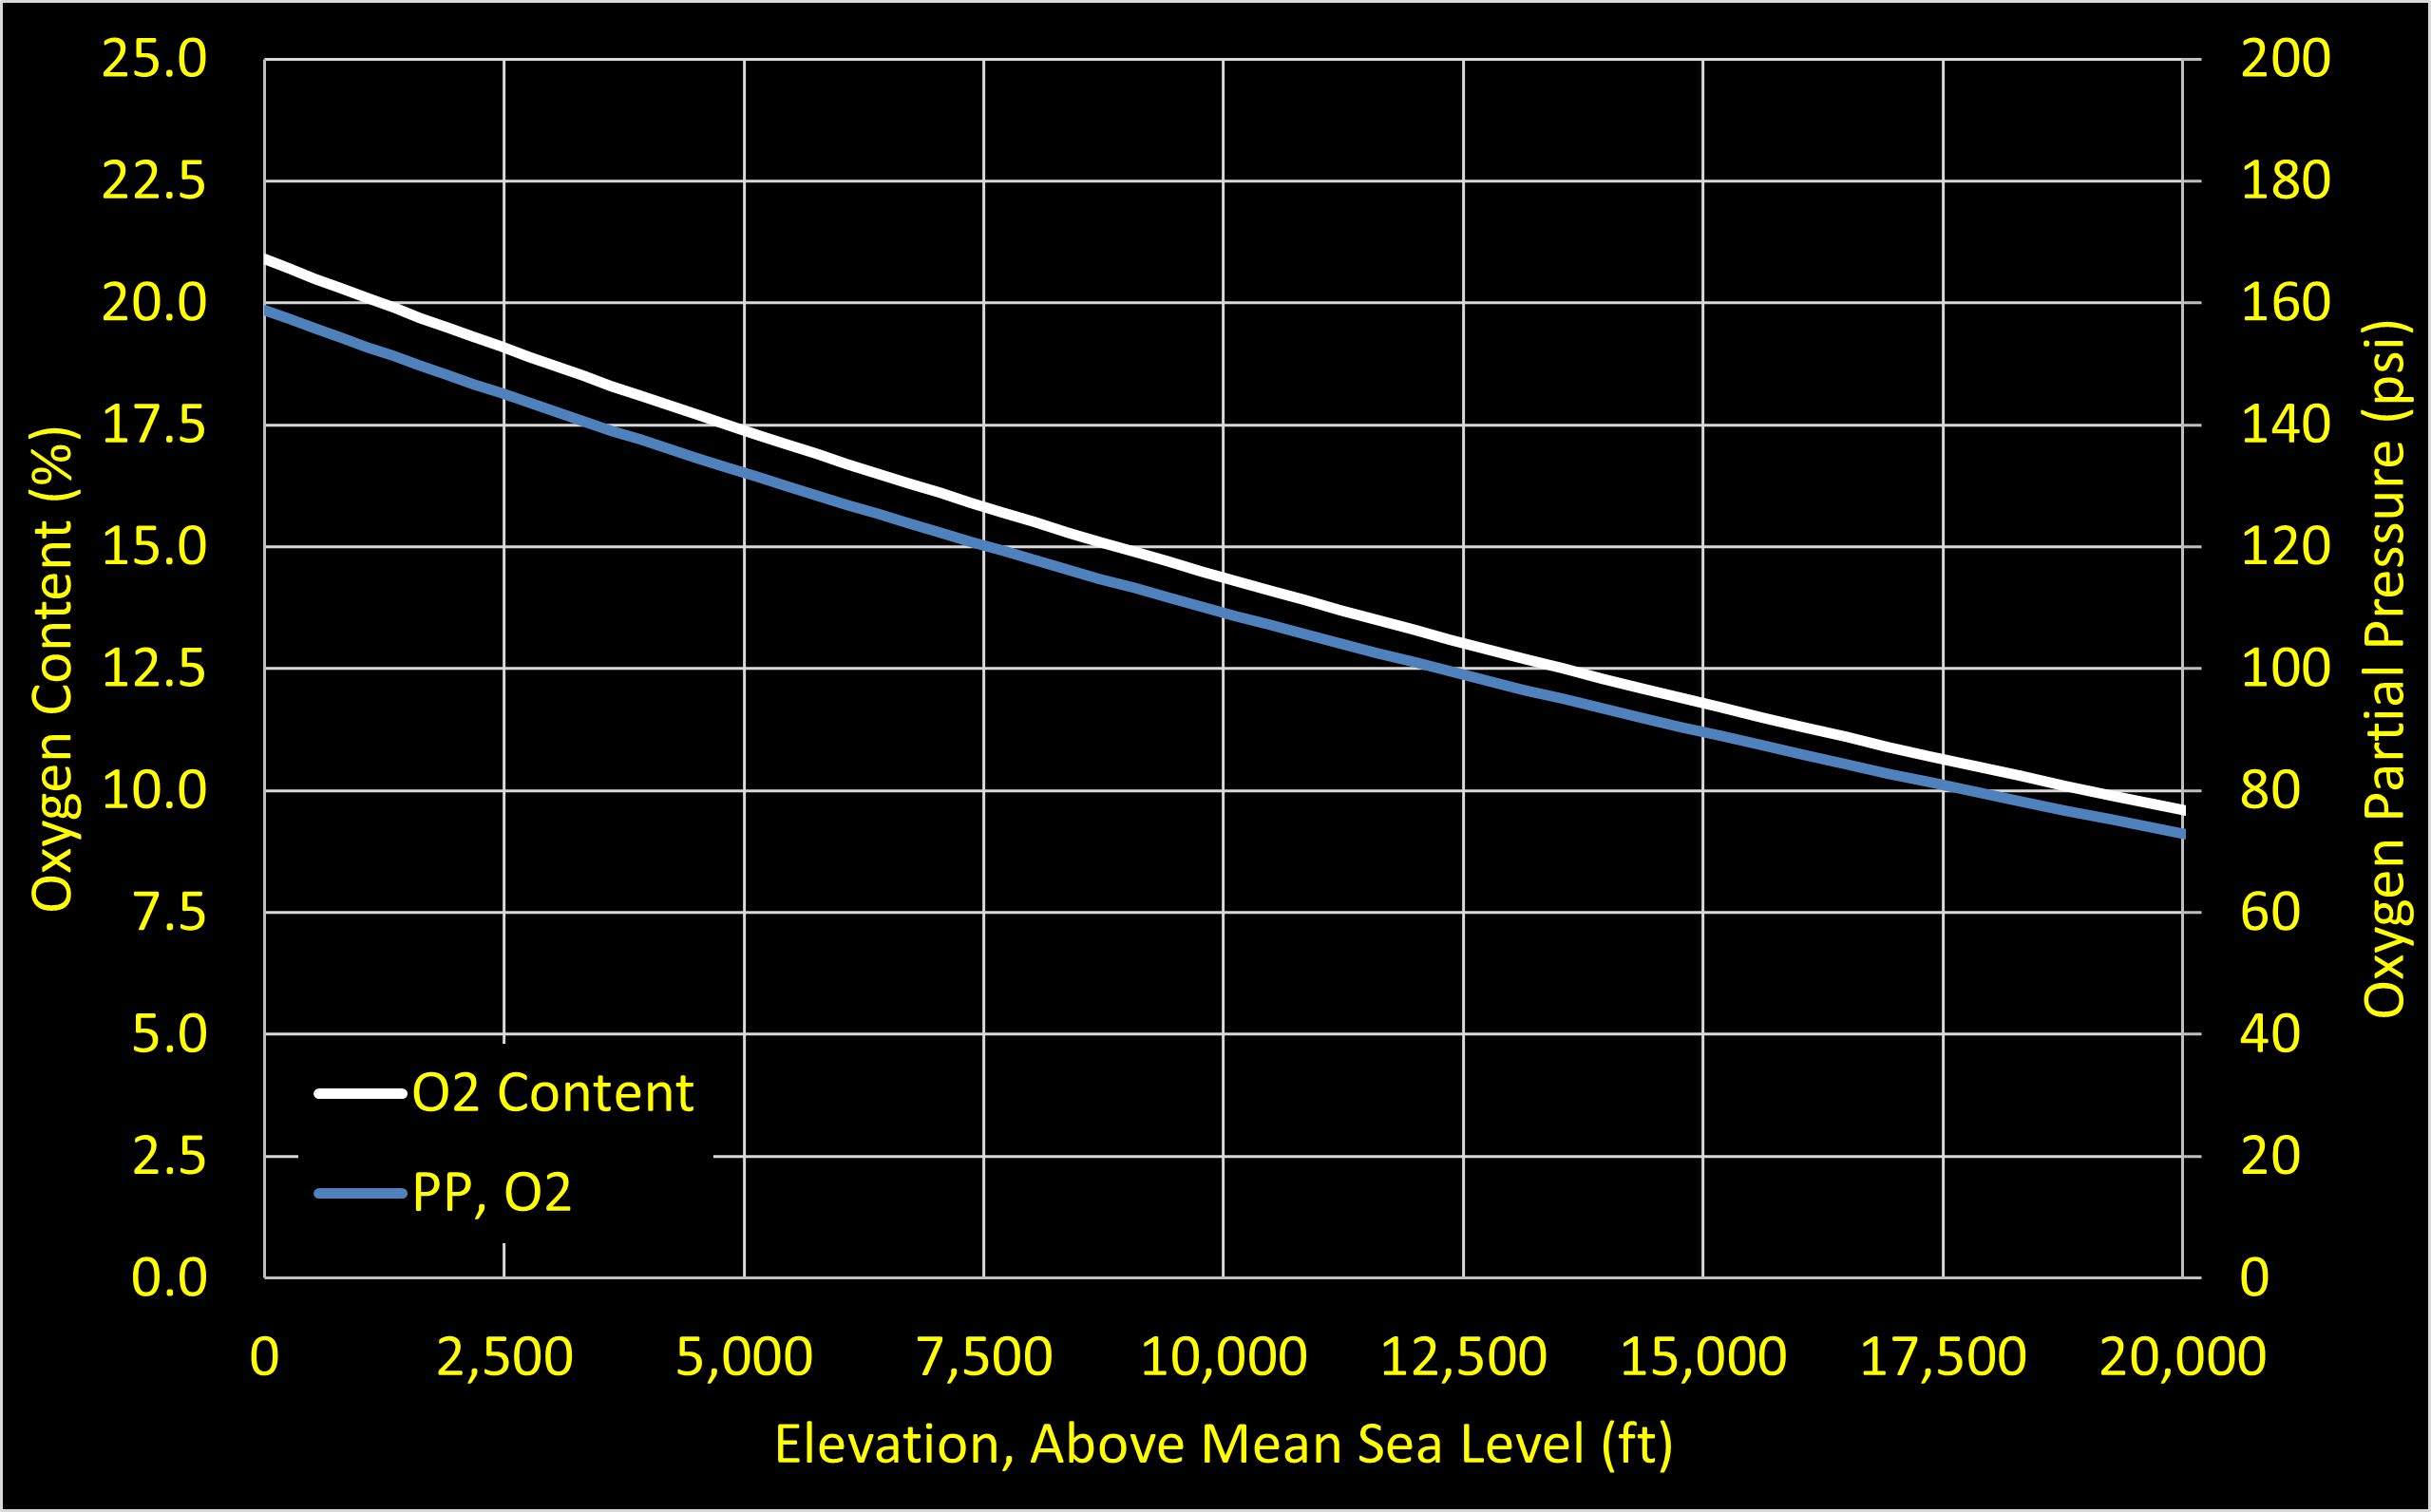
Aside from the physical demands of the 55-mile trek, as well as the fatigue associated with camping in the elements, one of the most daunting aspects was the altitude and changing oxygen (O2) content. We often talk about subsea and the changes in metocean data with increased depth. We generally see a rapid decrease in temperature (nearly liner), but then a slow asymptotic decline down to 3-4°C at depths > 1000m. Once we are below this point, there are not a lot of incremental changes that occur (thermally)

Compare this with oxygen (O2) content above sea level, as a function of increased altitude. Here, the decrease is nearly linear with increased altitude. As it relates to Kilimanjaro (19,341 ft peak), the O2 content is less than 50% of that at sea level (9.8% vs. 20.9%).
The changing altitude has very profound effects on human behavior, namely oxygen saturation levels in their blood. Effects of high altitude sickness can include::
Headache, dizziness, nausea
Fatigue, loss of energy, problems with sleep
Fluid build-up (lungs and/or brain)
Coming from Houston (0 ft above mean sea level) makes the ascent challenging, regardless of fitness level. Accompanied by two medical porters on the climb, they routinely monitored the climbers not only for the signs of high altitude sickness, but also measured body vitals to supplement their observations. A very Pontem approach!
Kili’ng It
Aside from the typical SmartWatch / Garmin diagnostics of steps, elevation, etc., pulse oximetry was taken every night on the trek to monitor climber health. This was used in combination with visual observations, past experience, and general performance/fitness to assess wellness for continuing the climb.
NOTE: The PulseOx was used as a tool, not a definitive. No readings were taken in advance of the climb (to establish each person’s baseline) and not all measurements were allowed to get to ‘steady state’ each night (i.e. they weren’t held for 60 seconds to ensure equilibration). So, like all good measurements, these were (a) indicative, (b) trendable, and (c) used to supplement other observations to come up with a holistic assessment. Now….here’s the data:
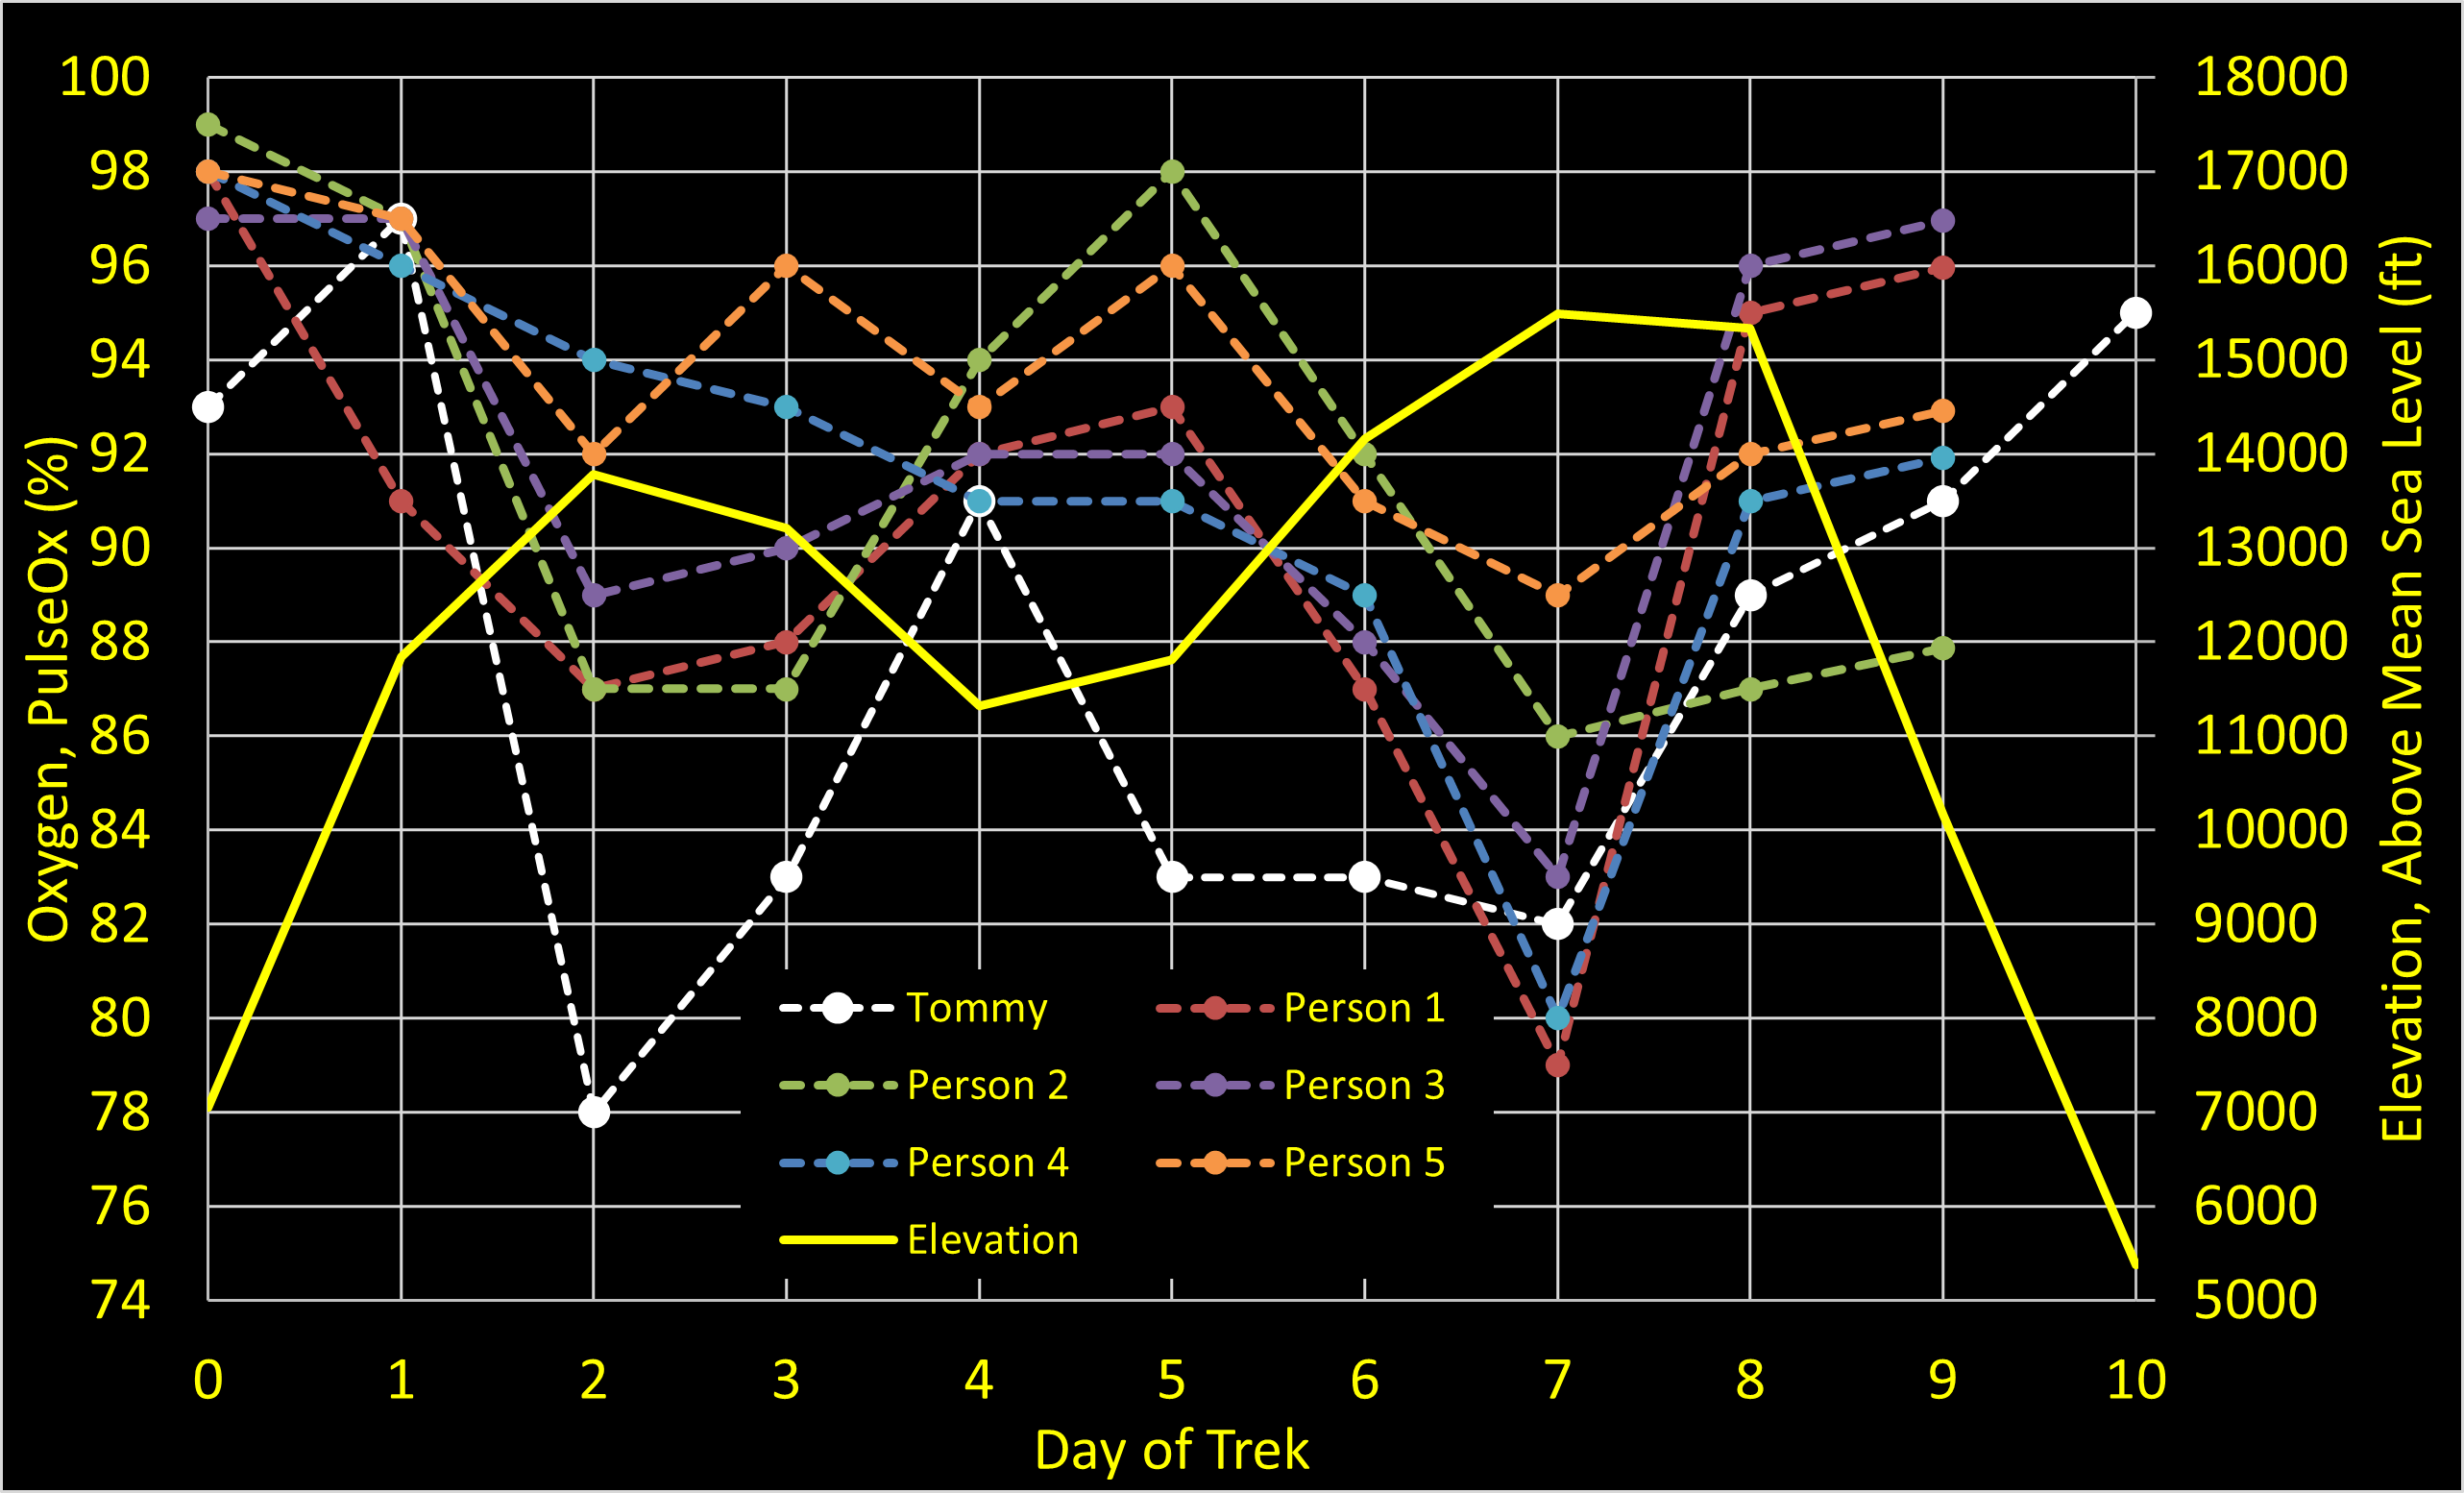
PulseOx readings for 6 climbers (including Tommy) are given below, as a function of elevation. At a high-level, the trends make sense - each person’s O2 saturation drops with increased altitude, as expected. Note that we did not measure O2 saturation at the summit - that time was used for pictures, vomiting (not me), and “sippy sippy” (a reminder to hydrate!)

Some of the climbers live at altitude, while some do not. So, the baseline O2 numbers vary by home location, age, gender, etc. What is interesting is the CHANGE in O2 throughout the climb. The graph below shows the route (yellow line), which had some ups / downs (for acclimatization), before the final push up to Uhuru Peak.
Speaking specifically about MY readings, here is what I remember:
Day 2 (14,000 ft) was NOT a fun day. While I don’t believe the 76% O2 reading was correct (my fingers were freezing), I definitely did not feel good. After 2 x 1hr sleep nights, I was feeling the effects of altitude, more than the others for sure. Not physically - the physical climb was relatively easy - but it was like skiing with a hangover. All day. And then sleeping at the top of the mountain in your ski clothes. Not pleasant.
Day 4 (11,000 ft) was a GREAT day. The couple days at “lower elevation” felt like sea level and the rebound to 90% O2 was another confidence booster. Truth be told, I did grab the tea kettle before the reading, so warming up my fingers *may* have contributed to the higher reading. But, isn’t that always the uncertainty with thermocouple readings - are we reading the true temperature? Either way, I was annoyingly optimistic. Positive Mental Attitude and David Goggins, LFG!
Day 7 (15,500 ft) wasn’t terrible, but several of the other climbers really struggled. These were the folks who lived at altitude and/or had done training with higher altitude hikes. Its possible their body took longer to (de-)acclimate and started feeling the effects later, whereas I took my lumps early. So, relatively speaking, the “downward slope” of the others was indicative of how they felt, whereas I was perhaps ‘Comfortably Numb’. Some of this could be nerves too, as we all knew the summit ascent was 6 short hours away.
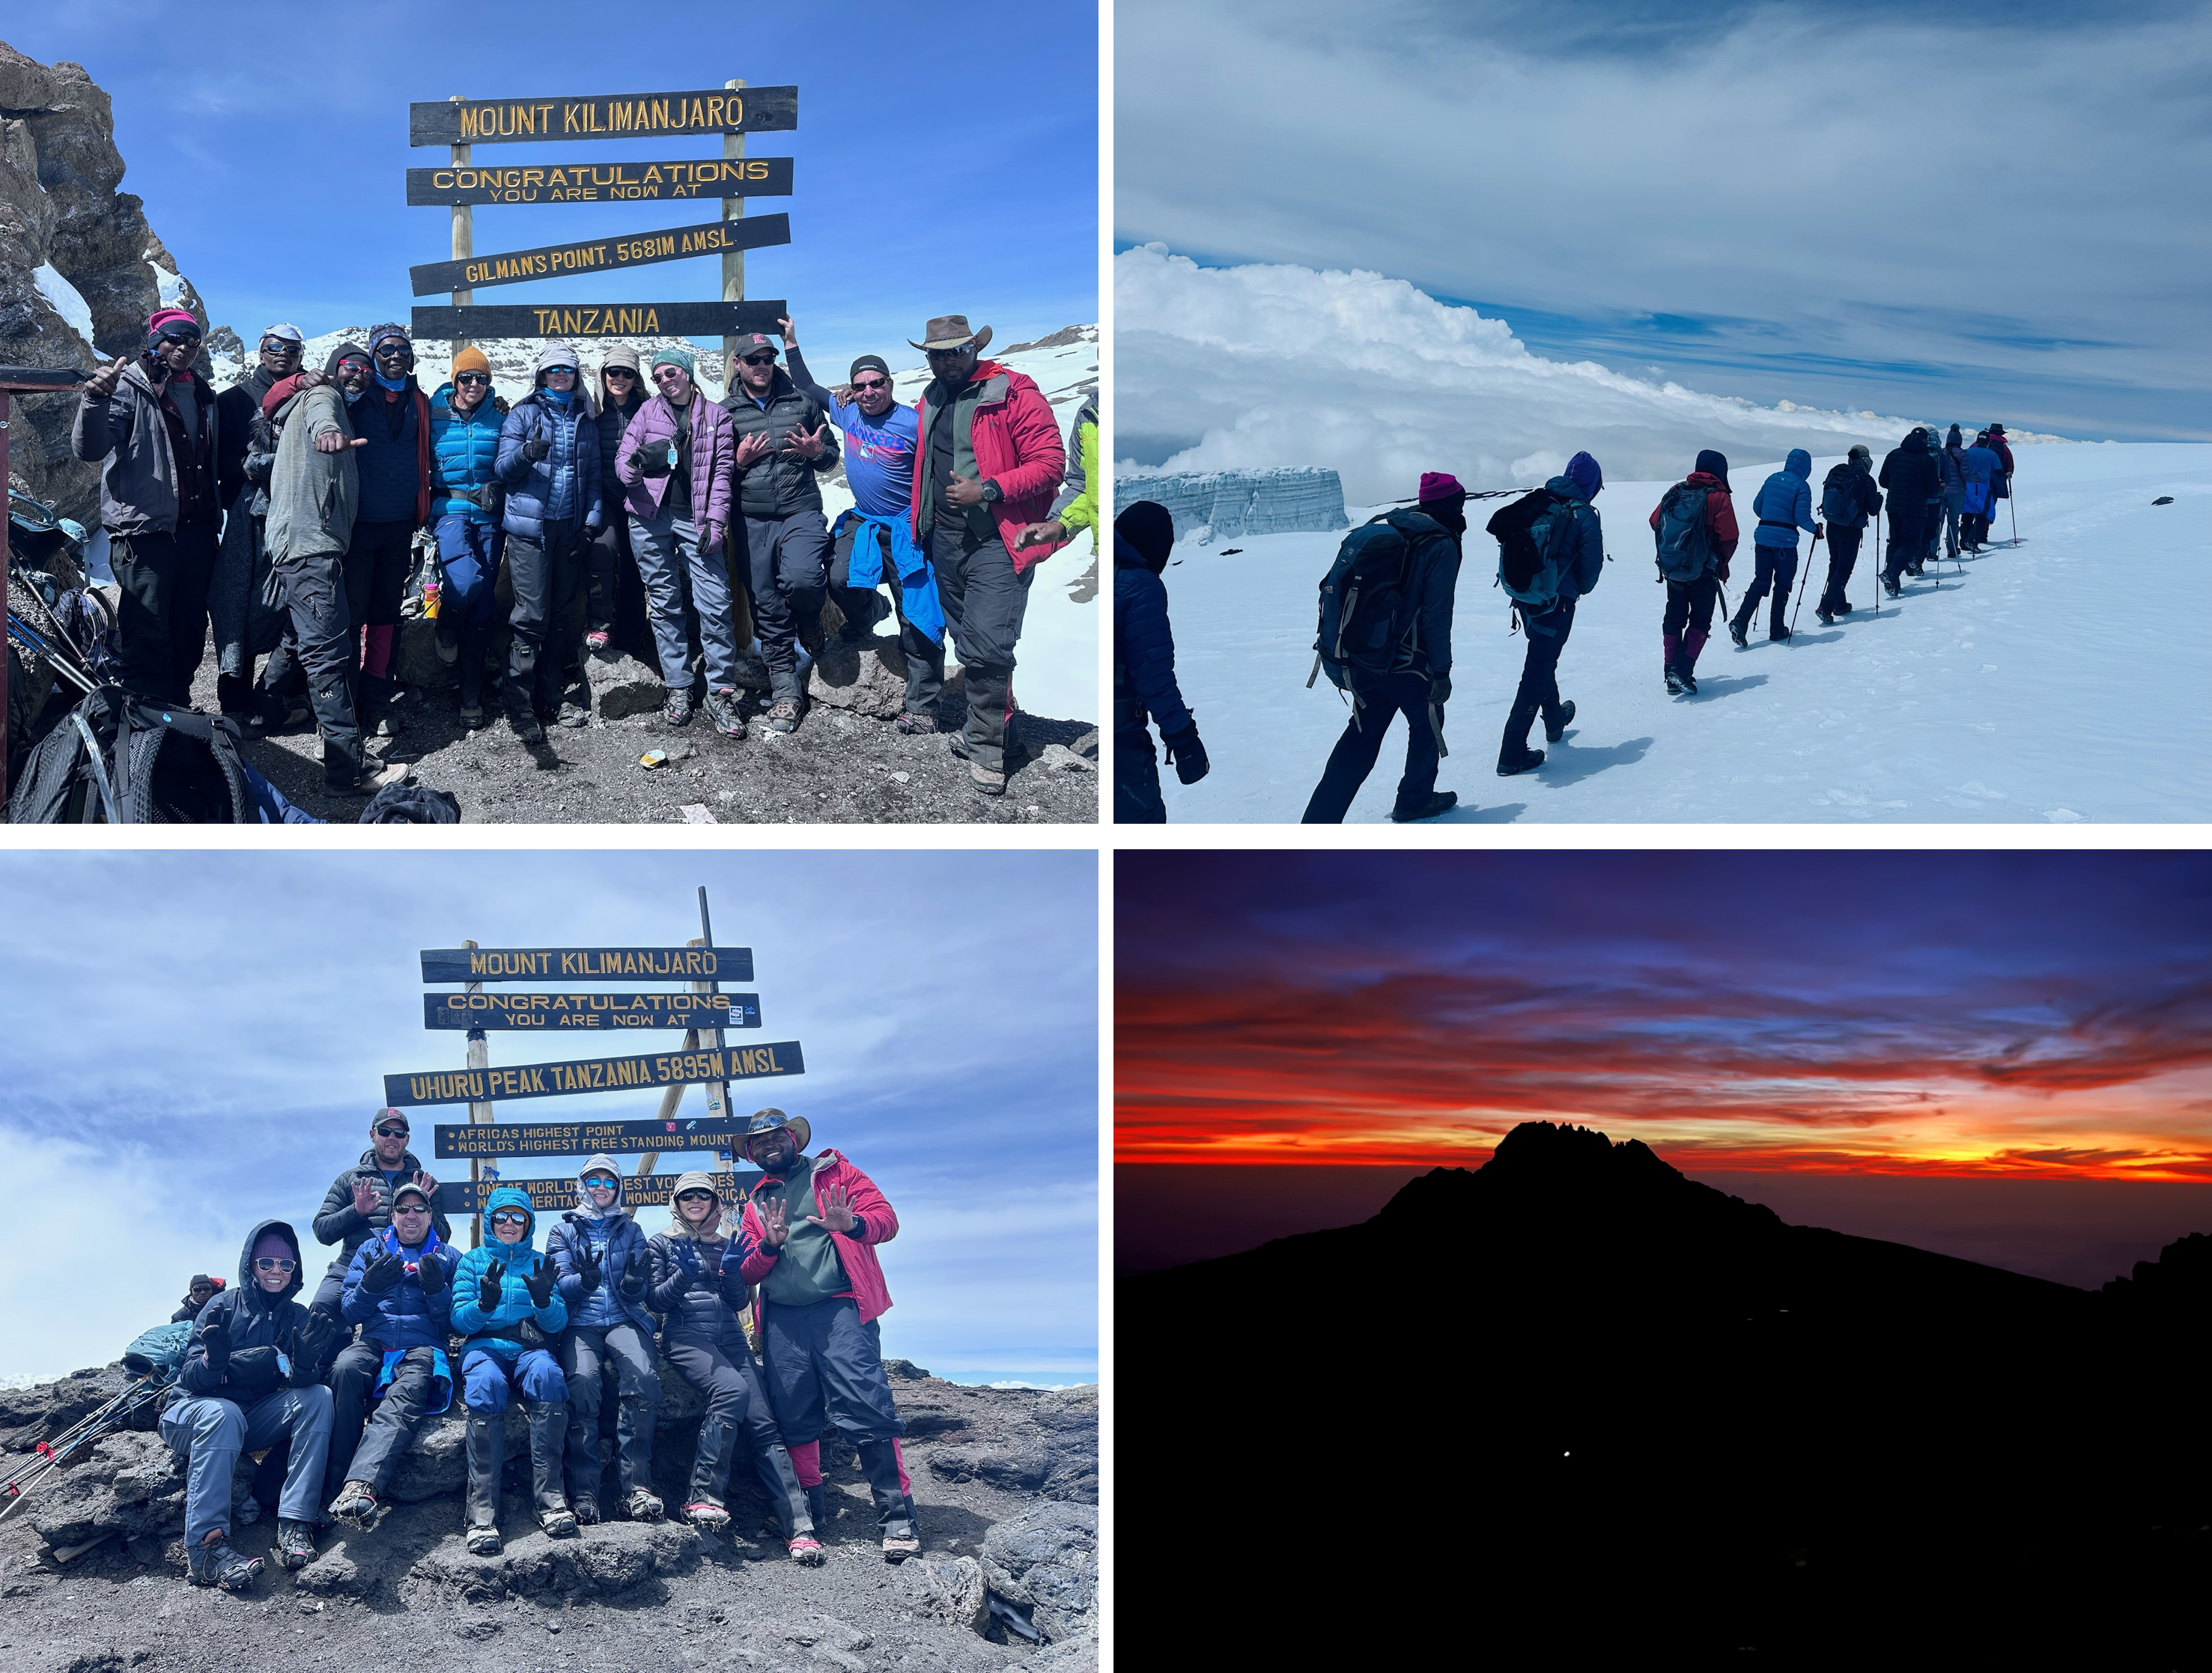
Day 8 (15,000 ft) was summit day - we went from 15,500 - 19,341 - 15,000 ft. Was this our bodies finally acclimating (we all started sleeping better by now) or was there a problem with the PulseOx reader? Or, was there some hysteresis here, since the reading was taken after a 4000 ft descent? Hard to say, all could be true.
Day 9-10 (<10,000 ft) back to normal. As expected, the lower altitude definitely increased O2 levels and restored vitality.
Seems that I experienced some of the more wild swings in O2 over the course of the trek, and earlier than others. Could be that I was coming from sea level or could be that I am just strange? Either way, I was not alone in feeling the effects of altitude, but I was fortunate to have most of the pain early (rather than late).
A similar graph was generated for resting heart rate, showing the generally increased heart rate as a function of elevation. Partly nerves/excitement as the summit approached, but undoubtedly related to physiological changes with altitude.

I should add that of the group of climbers, everyone was in the medical field and highly competitive (multiple MDs, pharmacy owner, etc.), so the nightly PulseOx / Heart Rate measurement turned into a contest…that could also contribute to the increased heart rate or perhaps some subtle moves to get a better reading (changing figures, warming them on tea kettle, waiting longer to report readings, etc.).
Pontem Africa: Hakuna Matada!
Ultimately, we all made it! I’ve done my fair share of Colorado’s14ers, but this was something else. Operating above 15,000 ft is a challenge, to say the least. Extreme environments and hard problems. Feels like a Pontem journey, for sure. Who would have thought we could weave a Multiphase Flow post with a Mountain Climb post…thanks to the Tanzania connection, its possible.

If it's your job to eat a frog, it's best to do it first thing in the morning.
And If it's your job to eat two frogs, it's best to eat the biggest one first. (Mark Twain)
Hopefully, we ate the biggest frog to start 2025. Apologize about the lack of email response so far in 2025, been busy. Back to work…unless we decide to make this an annual Team Building / Client Appreciation event….
Hakuna Matada!