This week I attended posit conf 2023 (formerly known as RStudio conf). It was my first time attending the conference live despite often catching up on recorded talks in years past.
Attending this conference in the past as an engineer in the oil and gas industry didn’t make much sense on paper. But now as a part of Pontem, we are leveraging this vast array of emerging technologies across all our various verticals and keeping up with the ever-changing landscape is crucial.
General theme: Python vs. and R (canceling the age old debate)
Ask most data scientists what language they prefer and you’ll likely get one of two answers, either python or R. Over the last decade, as data science has taken off, this has created an ongoing debate within the community. Without triggering anyone, I would say it’s analogous to the debate around PC’s vs. Mac’s.
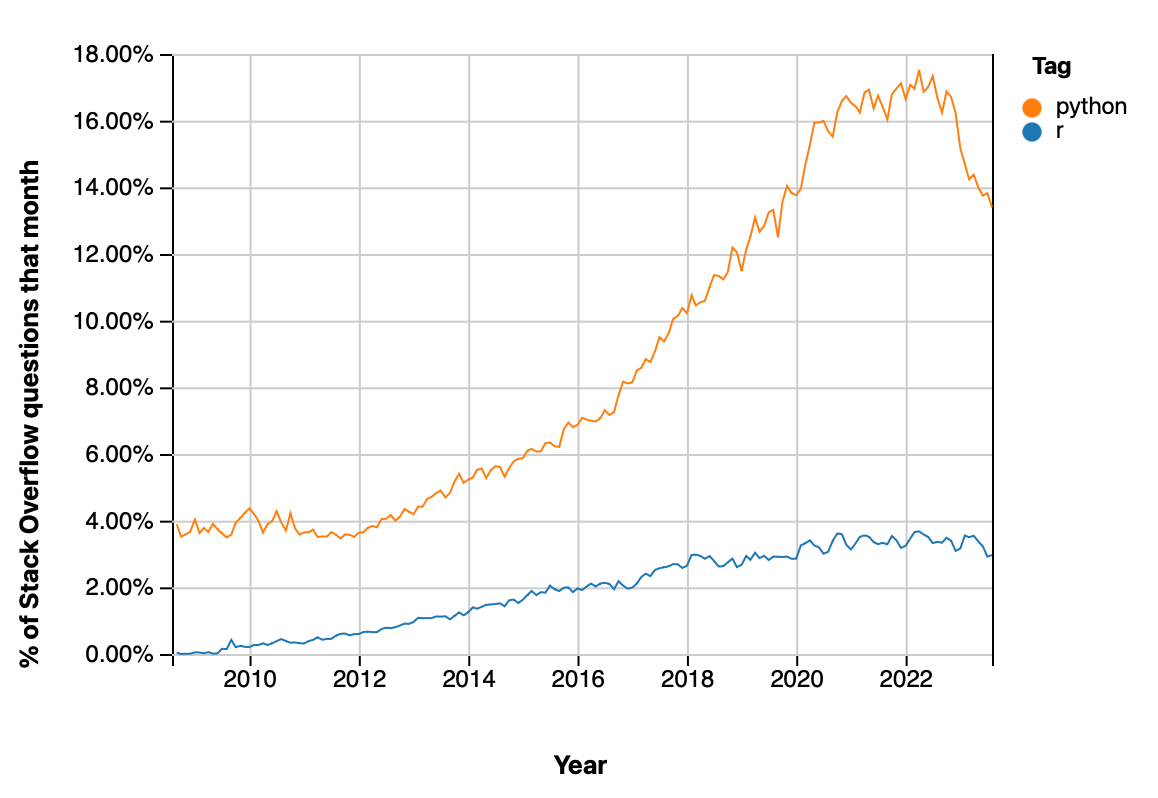
Python is probably the overall dominant language (looking at Stack Overflow trends). It’s supporters point to the language’s ease of use and low learning curve, it’s huge user base, and the ability for it to be used across a wide range of applications ranging from data science and machine learning to web development.
R on the other hand, in the past has generally been regarded as a more niche language with a core focus on statistics, data analysis, and visualization. Many seasoned R users recognize the language has a steeper learning curve, but once over the initial hump, you begin to realize a truly powerful syntax that let’s complicated processes be accomplished in minimal coding steps.
Posit is primarily a company that is focused on R (they used to be called RStudio after all). However, through their recent rebranding they have also acknowledged a need to ‘bridge the gap’ between the two languages in order to offer users a more powerful technology stack from which to choose.
I give posit a massive credit here for taking this on and I’ve been very happy with the work they have already achieved in making these languages able to be used more seamlessly across various tools and in collaboration with each other.
Their effort was very clear in the conference this year and to me was one of the focal points of the entire event.
What’s New in Quarto (Talk 1072)
Speaking of bridging the gap between languages, if you haven’t heard of Quarto, you should absolutely check it out. Prior to the days of Quarto (pre-2022), if you were a python user, you generally relied on Jupyter notebooks, however if you were an R user, you had an arguably even more powerful tool called R markdown notebooks.
To back track just a bit, Markdown is a popular syntax that lets you easily create documents (generally for the web, although also in other forms such as PDF) using a simple mark up language that gets translated into various styles. The syntax is straight forward and while you don’t necessary have unconstrained freedom over customization, it does provide a ‘standardized’ layout for a document with various headers/sub headers/etc. that look nice and can’t be easily messed up.
Coming back to the R community, with the invention of Markdown a while back, developers within the R community quickly realized that a natural extension of Markdown would be to support writing and ultimately running of R code during the compiling step.
This was a massive success and RMarkdown became rather mainstream in the R community giving data scientists the ability to write technical papers, blogs, presentations, and even publish books all from a single source.
Posit recognized the power of this framework and wanted to open it up more broadly to python users while simultaneously enabling the core engine to be used in many open source data science tools (instead of only Studio). This is where the idea for Quarto emerged and it was officially introduced at last year’s posit conf.
The talk this year focused on several interesting advances in Quarto during the last year, including the following (grouped by categories):
Content
Embed output from other documents
Cross reference anything
Inline execution for Jupyter (something that existed in knitr already)
Add context to code
Projects
Create projects more easily (through terminal for example)
Generate variations with project files
Tools
Visual editor in VSCode (a game changer for inputting tables!!)
New JupyterLab extension
As someone that regularly writes reports for studies during my work, I do wish that other industries outside of just data science would embrace the workflows achievable using version control and text readable document formats like Quarto. Just imagine the number of document control issues that would disappear if we could adopt reproducible approaches!
tidymodels: Adventures in Rewriting a Modeling Pipeline (Talk 1082)
If you are a regular python user in data science, there’s no doubt you have heard of the scikit-learn library, which contains a massive set of machine learning algorithms and supporting tools for pre-processing data and evaluating model performance. As I mentioned in the opening of this summary, this library and many others supporting it, have given python the upper hand in data science and machine learning in particular.
Well, a few years ago some of the leaders in the R community set out to begin building their own ecosystem for creating machine learning models within R utilizing the common “tidyverse” framework that so much of R relies on. This collection of packages is appropriately called the tidymodels framework, and it too contains various libraries built for pre-processing, modeling, and even deploying code for production use.
This talk gave a great example of how the tidymodels framework was used to deploy a real world data pipeline and how it enabled easy and automated scaling when delivering model improvements showcasing just how far R has come “in production”.
Data Visualization with Seaborn (Talk 1136) and Grammar of Graphics in Python with Plotnine [TALK-1137]
On to one of my favorite topics…data visualization.
One of the areas most cited as a strength of R over python is data visualization. This is in large part thanks to Hadley Wickham’s ggplot2 package in R, which implements a ‘grammar of graphics’ approach to visualizing data.
What makes this approach so unique and powerful is that the complicated parts of building a visualization are abstracted away into a language that is used to more or less ‘describe’ what you are trying to achieve. This relates not just to a particular type of plot, but the various aesthetics and even scales associated with it.
With ggplot2 solely in R, there have always been opportunities for python to catch up in the visualization space. Matplotlib is generally the go to library for visualization in python when you need complete control over the creation of a particular graphic. But the problem that matplotlib suffers from (and what makes ggplot2 so nice) is that constructing graphics is a very computer science intensive task, requiring the instantiation of objects for various aspects of the graphic.
Seaborn is one library that attempted to make the creation of graphics, and in particular statistical graphics, much easier. The creator and maintainer of Seaborn was around on Thursday to give an update on this fan favorite package in python.
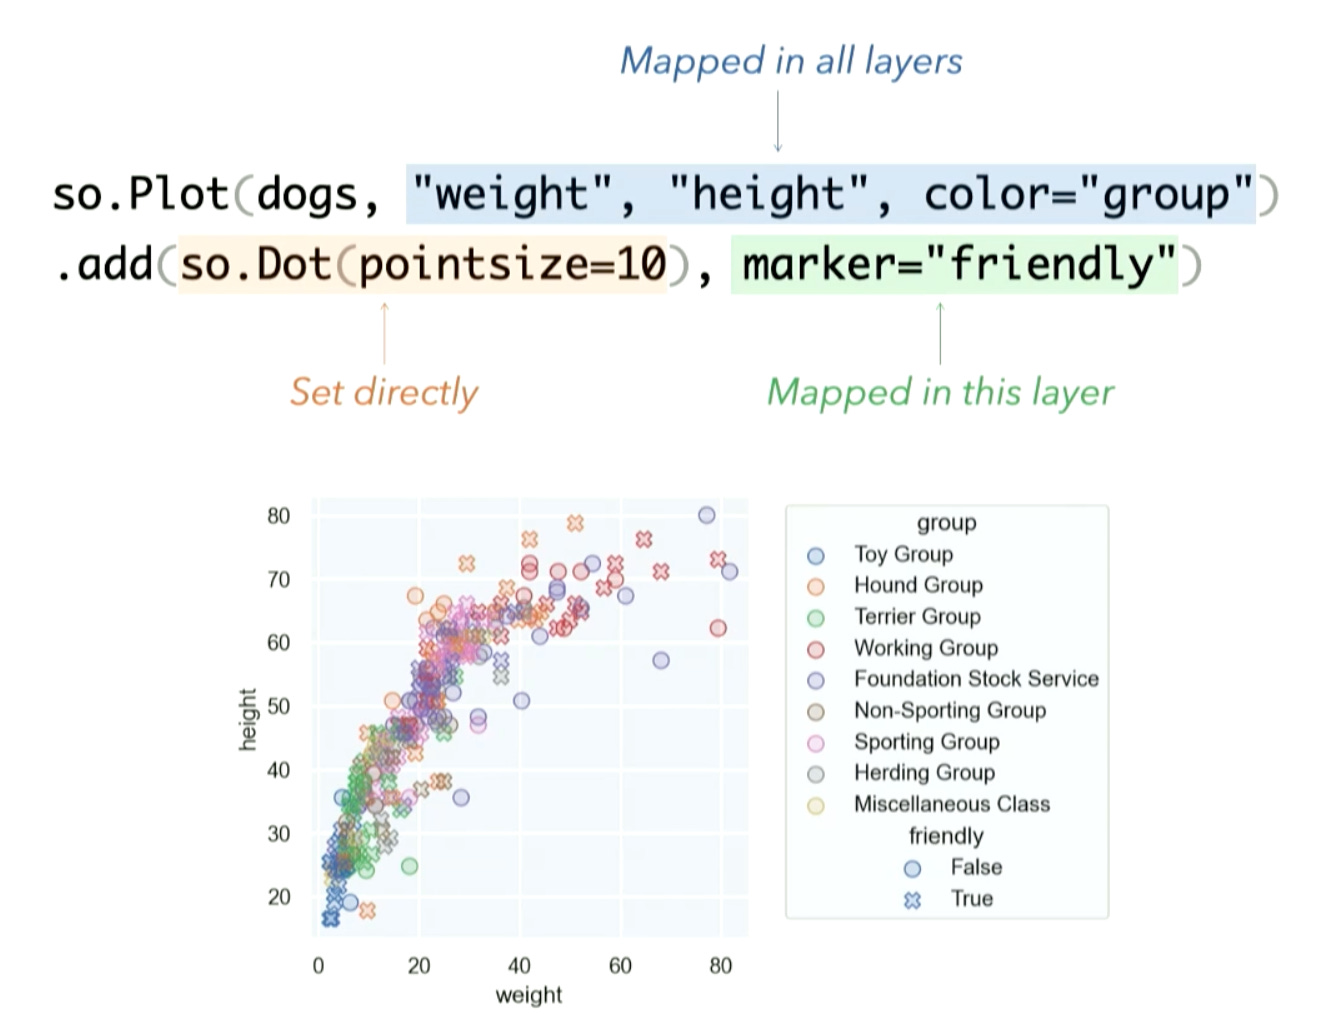
In short, he discussed a few small updates to the core Seaborn library, however, his big announcement was a brand new API within Seaborn that approaches graphic creation in a grammar of graphics manner. This new approach called ‘seaborn objects’ allows for more direct control over graphics creation without needing to reach in the underlying matplotlib API.
But as the creator of the Seaborn package said himself, even this new API is not meant to be a replica of ggplot2 in python and if that is what you are after, then look no further than the PlotNine package.
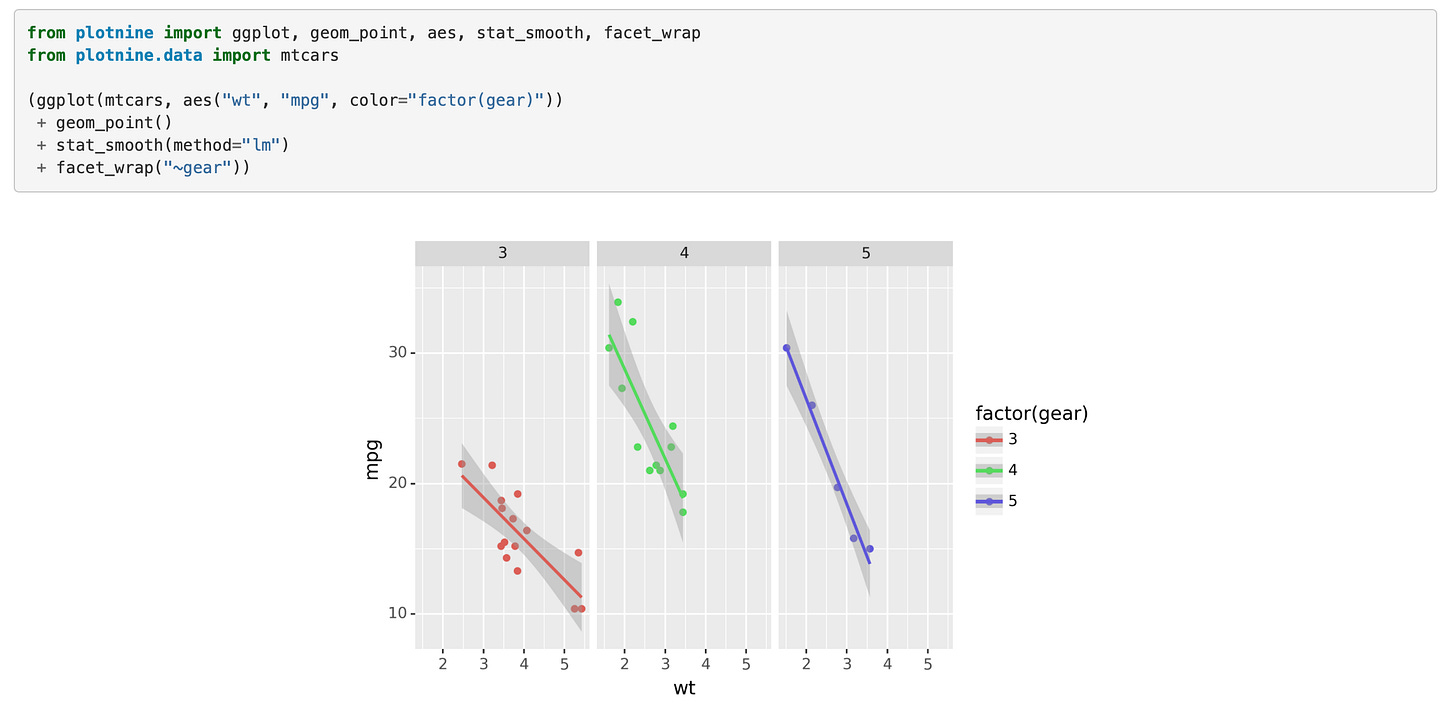
The PlotNine package copies the ggplot2 syntax nearly identically, offering the same keywords verbatim with only minor syntax changes like the need to set aesthetics with strings instead of calling directly. And if you’re curious where the name comes from, it’s from the 9 various components that make up the grammar of graphics:
Data
Aesthetics
Scales
Statistics
Positions
Geometric objects
Facets
Coordinate system
Theme
Just as ggplot2 is used to create all kinds of impressive graphics, the author of the PlotNine talk, who is the creator and maintainer of the package, also did some showing off of his own by creating a guitar graphic complete with varying lengths on the frets.
Final thoughts
As mentioned, a major theme in my mind of the conference this year was showcasing strengths of either python or R, where the gaps between the two languages are being closed, and how to successfully leverage tools that can function with both. Because of these advances, we are nearing the point where choosing between python and R is based solely on preference as opposed to functionality or necessity.
It’s exciting times in the thriving world of data science as so many new tools are being produced to help better extract meaning and value from data. I’m looking forward to attending this conference again in future years.


