
Case Study – Enhanced Operations via Scale Treatment Optimisation
Operational optimisation of scale management via domain knowledge and data analytics

Real Time Challenges
Rapid assessment and reaction to real time challenges in production systems is essential to avoid system upsets and maintain efficient, cost effective and safe operations. At Pontem Analytics we maintain a nimble and reactive environment, complemented by our domain expertise in flow assurance, process, production chemistry and data analytics, to enable this level of support and provide solutions for our clients.
In a recent case study, we identified and provided mitigation for a suspected scaling problem in a client’s deep-water operations, which would otherwise have required significant intervention. We did this via application of a data analytics approach and our domain expertise in thermo-hydraulic modelling and scale precipitation mechanisms and treatment.
Optimizing Operations Now and in the Future
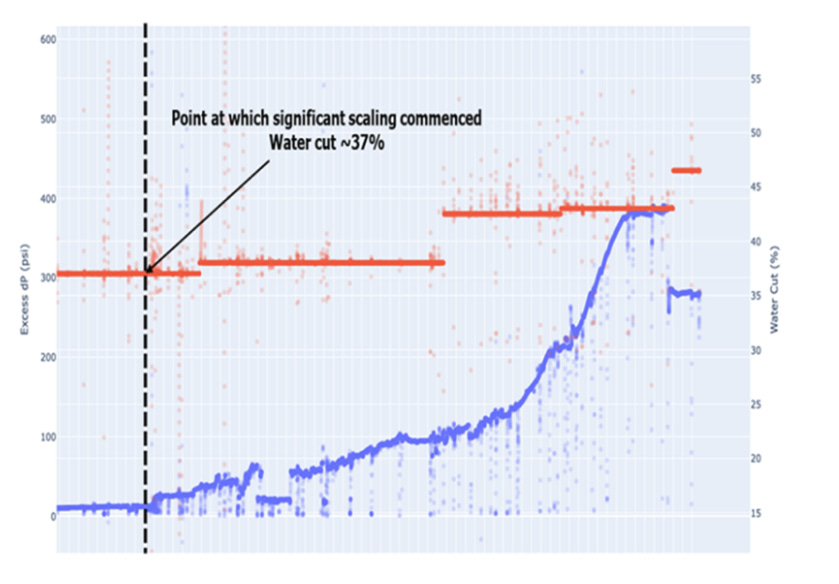
We were asked by an operator to look at their deep-water field to evaluate a prevalent issue manifesting itself as an increase in pressure differential (dP) across a well jumper (See Figure 1).
A review was performed of the organic and inorganic compositions and associated risks compared to the operating conditions. Considering the coincident water production, dP increases and corresponding compositions it was concluded that inorganic scaling from the produced water was the main contributing factor, while organic deposition (e.g. wax, asphaltenes etc.) was low. However, this was not the full story and further investigation presented additional flow assurance issues that required management.
What gave an added twist to this case was the requirement to also provide a forecast of how all the operational challenges will change in future operations should the subsea system pressure decrease further, required to increase production.
Why Pontem?
Ultimately each individual part of the study could have been done by any number of in-house technical teams or third-party consultancies, but to complete the study in its entirety required a skill set that very few companies have. Fortunately for the operator in question Pontem have the diversity of expertise to provide all the required skills in one place and provide solutions for each of the following, considering the impacts on each other:
Inorganic scale deposition
Asphaltene deposition
Internal corrosion of the carbon steel subsea jumpers, flowlines and risers
Hydrate blockage potential
Paraffin deposition
Erosion
With the field being >15 years old there was plenty of information available when it came to data analytics. This, alongside the size of the subsea system and it being at water depths of >1000 m, added an additional layer of complexity.
The Problem to Solve - Inorganic Scale Deposition
For this post we will focus on how we approached the inorganic scale issues. To fully understand the problem and potential solutions we need to look at the past, present and future to investigate the following:
1. The asset’s historical production data.
Here we looked to identify any points during the previous production cycle where known issues of deposition or other flow assurance related problems have occurred.
2. The asset’s current chemical treatment options and chemical injection infrastructure.
To ascertain the value and effectiveness of the chemicals being injected and whether new chemicals were required or would be beneficial.
3. The impact of decreasing subsea system pressures
The aim here was to look at whether the calcium carbonate scaling problem is exacerbated and if it was going to affect other areas of the production system
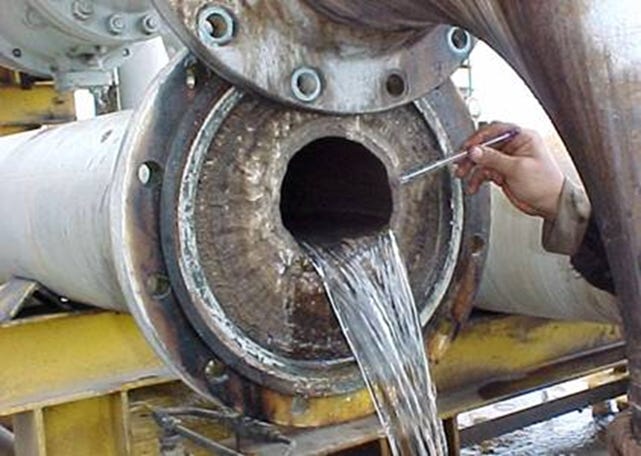
We started with analysis of the data in Figure 1 from a single well jumper, showing the pressure drop across the jumper. This demonstrated that, for the well in question, there was evidence of scale build-up in the well jumper. This data also showed the water cut where the pressure drop across the jumper started to noticeably increase, in this case ~37% water cut. The overriding concern with scale precipitation is not to end up with something like the picture below!
Jumper Scanning
Jumper inspection was performed using a tool that attached itself to the outside of the jumper and used a radioactive source to penetrate the internals of the jumper to see if any solids had deposited. Very similar to having an X-ray (see Figure 3).
When an inspection of the jumper at risk was performed the tell-tale signs of inorganic scale deposition were there to be seen. Thankfully this wasn’t quite as bad as the picture above, but there was evidence of significant amounts of scale forming around the internal circumference of the jumper.
Figure 3 - Cross sectional area of the Well 4 jumper after inspection

But What Scale?
The inspection helped us identify scaling to be the cause of dP increase. The next step was determine what type of scale this was. Using our domain expertise we performed scaling predictions, using Scalechem, a scaling prediction software, to confirm that the deposit was calcium carbonate.
When evaluating the scaling risks, Scalechem provides a Scaling Tendency (ST) for the produced water being assessed and the potential mass of scale that can precipitate from one litre of water. A scaling tendency >1 indicates that thermodynamically scale is likely to precipitate.
This approach was applied to the entire production system to identify the wells most at risk from calcium carbonate scaling and provide an indication of the potential mass of calcium carbonate scale that may precipitate, which is dependent on the water production from each well. The results of this work are shown in Figures 4, 5 and 6.
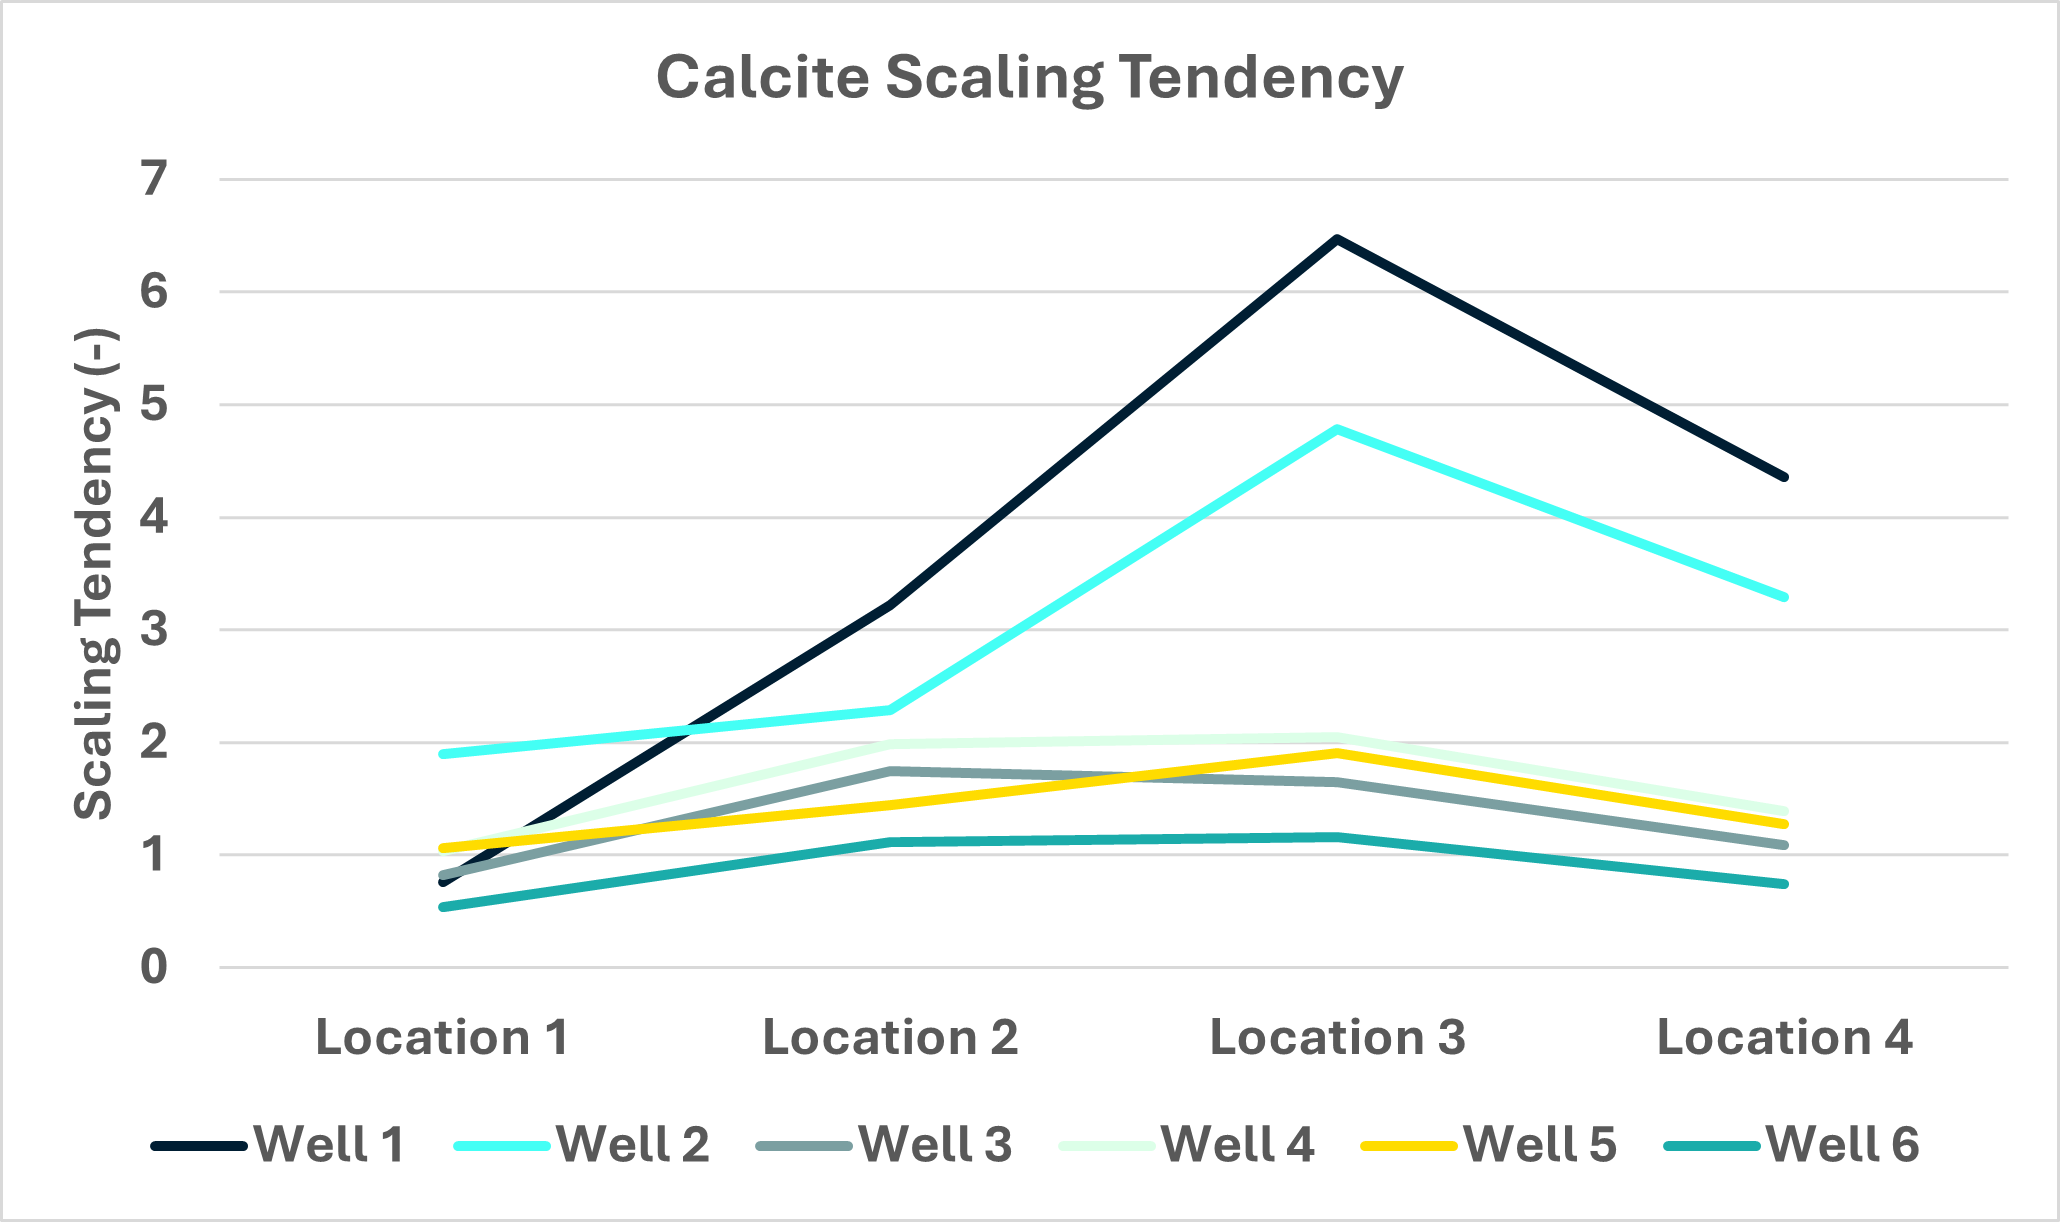


Figure 6 provides an indication of the mass of calcium carbonate scale that may precipitate in each well and jumper during operations on a daily basis based on the water production rates. While ST provides a thermodynamic view of scale formation and concentration (mg/l) data can provide rates of scaling mass, the holistic view of how much mass (Figure 6) is critical to evaluate scaling risk and severity. For example, Well 4 looks like it might not have a problematic scale concentration, it turns out that it produces the second highest mass!
Risk Locations and Severity
Although Well 1 thermodynamically has the worst scaling conditions it gets relegated to 4th place from a scaling risk perspective once you account for its low water production. Wells 2 and 4 conversely increase in scaling severity because of their high-water production rates.
It is also worth mentioning that the masses provided in Figures 5 and 6 are the theoretical masses that could precipitate out at the thermodynamic conditions analyzed. It is not the mass of the scale that could actually deposit.
To truly interpret the scaling risk the results from Scalechem require interpretation by a good chemist knowledgeable in the stochastic nature of crystal formation and how that can be influenced by such things as:
secondary solids in the system
the system shear / mixing
potential crystal nucleation sites on the side of the pipe wall.
Taking this into account, means that it is not 100% certain that scale will form even if results say you have a risk, consequently, we have “scaling rules of thumb”. As with many risk assessments each operator tends to have their own guidelines. Scaling rules of thumb applied are presented below categorized by scaling tendency and maximum precipitation mass and the corresponding risk associated based on the parameters.

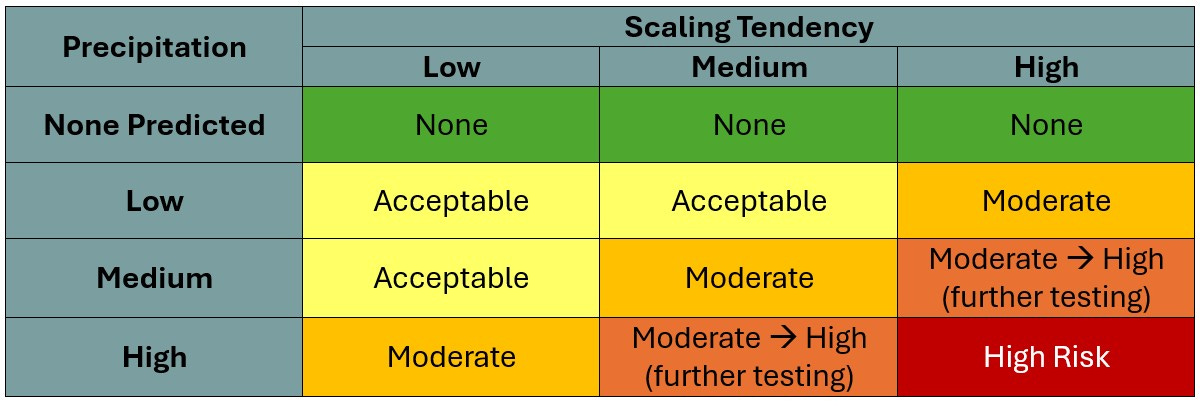
The information in the table is then used to determine the likelihood of scale depositing in the system, which is how Pontem have approached this problem.
Connecting the Models to the Data
With that done we were able to move onto the next stage of the investigation to determine whether the theoretical simulations corroborated what was being seen in the field with respect to calcium carbonate deposition and dP across the jumpers that are presented as ‘high risk’.
This was assessed by comparing the modelled dP in the well jumper in the absence of scale to the operating data for the time period where scale deposition is deemed a risk. The greater the deviation of the modelled jumper dP (PModel) compared to the actual jumper dP (PActual) the greater levels of scale deposition are likely to have occurred. This is represented by the dP trend and Y-axis in the figure below over time. If this trend line is flat and around 0 then there is no solids deposition in the jumper
Figures 7, 8 and 9 have been chosen to illustrate the operating data for a selection of the wells in operation. Figures 7 and 8 show increasing divergence in modelled dP predictions (PModel) compared to the actual measured dP (PActual) over time, which is indicative of the build-up of calcium carbonate scale, whilst Figure 9 demonstrates the dP relationship with minimal scale deposition.


The relationship for Well Jumper 6 (Figure 9) shows low deposition despite the flowing temperatures and water flow rates not being dissimilar to Well Jumpers 2 and 3, however the system pressure is greater reducing the calcium carbonate scaling tendency and subsequent risk. Calcium carbonate deposition is usually associated with a decrease in system pressure and high flowing temperatures.
Additional Factors
In Figure 1, which has historical data for the Well 4 jumper, the data to the left of the black dotted line shows quite clearly that at lower water cuts even though inside the scaling region there is no significant increase in dP. This is down to the fact that left of the black dotted line, the system was producing a water-in-oil emulsion thus preventing the scale from depositing.
This fitted in with how the system was being operated and the system conditions being experienced. Before the first decrease in the subsea system pressure there was no indication of scaling occurring even with flowing temperatures >75oC but after the pressure decreased and the water cut increased above 37% scaling quickly became an issue.
The importance of the water cut in this case is that below the water cut of 37%, the oil and water are being produced as a water-in-oil emulsion. This is where the continuous external phase is oil. Anything above 37% water cut in this case the emulsion flips to being an oil-in-water emulsion.
Why is this important I hear you ask?
It is important because when the water is surrounded by oil in a water-in-oil emulsion, the water containing the calcium carbonate does not contact the pipe surface so cannot deposit. This changes when the emulsion flips to an oil-in-water emulsion as that allows the pipe surface to be water wet and calcium carbonate to deposit.
The results shown in Figures 4 to 8 it confirmed that the well jumpers with the highest dPs were also the systems that had the highest predicted calcium carbonate precipitation. This removed any doubt regarding the conclusion that inorganic calcium carbonate scale was causing the increase in dP across the well jumpers.
Back to the Future….of Scaling
This piece of work sorted out the past and the present by identifying when the problems first started to occur and which jumpers have immediate problems. The next stage of the process was to determine what would happen in the future if the system pressure was decreased further to its lowest possible level to increase production.
This is significant because as with decreasing system pressures, scaling issues could migrate from the well jumpers to downhole. If this occurs it may require the injection point of the scale inhibitor to be moved from the Production Christmas Tree to downhole in the well.
To determine whether this was an issue, Pontem assessed the impact of decreasing system pressures on the scaling tendency (see Figure 10).

The results show that decreasing the subsea system pressure increases the severity of the scaling risk, but not to the extent that the problem was no longer treatable with the injection of a scale inhibitor. The main impact, if any, would be an increase in the scale inhibitor dose rate.
To identify the scale inhibitor dosing location required, it was importance to determine where the scaling issues are likely to start in each well and jumper. This was done by identifying the change in the pressure profile across the well caused by the drop in system pressure. This was possible via the use of the OLGA models that had been created for this process. Once the pressure and temperature profiles had been created these conditions were then compared to the scaling envelope that had been obtained from the Scalechem work.
The results of this work for the lowest potential system pressure are given in Figure 11. This shows the well depth on the Y-axis and the system pressure on the X-axis.
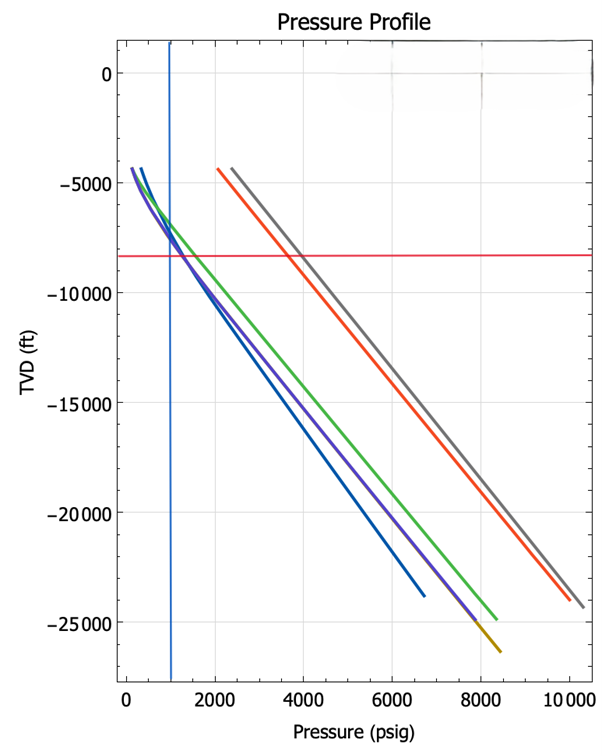
To make sense of Figure 11, we have to use the information we obtained from the Scalechem work. This illustrated that below a system pressure of 1000 psig and the flowing temperatures for the wells under review scaling may occur. By imposing those conditions on the graph above we can see that there are three wells (Well 1, 3 and 4) that are likely to have calcium carbonate scaling downhole. Consequently to ensure effective scale inhibitor treatment the injection point for the scale inhibitor must be deeper than 8,500 ft TVD for the wells in question.
With this in depth study Pontem were able to fully comprehend what was happening from an inorganic scaling perspective and provide the required mitigation measures. With our deep domain understanding of the problem, alongside a data driven approach, we were able to put together a simple flowchart to assess scale management in current and future operations.

By using this flowchart the operator now has a clear path forward for managing the calcium carbonate scaling problem in their system. The mitigation going forward is the introduction of scale inhibitor injection into the well jumpers that have been identified as at risk. For cases where scale has already deposited, scale dissolver treatments can be performed to remove the calcium carbonate scale.
With respect to any scale dissolver treatment, it is important you speak with an SME to ensure that any acid used will not have a detrimental impact on corrosion in the system. There are plenty of acid based scale dissolvers that have been specifically designed to minimize corrosion but maximize scale dissolution.
As for the flowchart it is worth mentioning that although created for a specific application Pontem Analytics can modify this to fit most systems at risk from organic or inorganic scaling. If you have any immediate scale problems you would like to get help with please do not hesitate to contact us.
Hopefully this post has been of interest. Keep your eyes peeled for how we approached the asphaltene, corrosion, paraffin, hydrate and erosion problems.