
Anatomy of a Water Sample
Always the Bridesmaid never the Bride!!

When it comes to collecting water samples in exploration and appraisal wells, they are usually an afterthought as water production is usually more associated with being a money pit than a revenue stream.

Don’t be lulled into a false sense of security with respect to water samples just because water isn’t usually seen as a revenue stream. It doesn’t mean that you don’t need to make sure you have got the right water composition.
But right from the get go, it can be difficult sometimes persuading your drilling team the importance of taking a water sample because any sampling exercise takes time and that can mean a lot of money especially for deepwater wells in harsh environments. The whole sampling exercise could run into a few million $’s for a handful of water samples. Taking that into account be prepared to do a cost benefit analysis showing the drillers why the water samples need to be taken.
The reality of the situation is that the composition of the water can make or break an oil and/or gas development. So, with that in mind you want to make sure the water composition used for design purposes is correct. If you get it right this is what happens:
1. Identification of the most suitable chemical injection locations
2. Selection of the right materials
3. Determination of the most optimum treatment methods
4. Optimum MEG Reclamation Unit (MRU) design and hydrate management strategy
5. Identifying the correct baseline from which operations can begin trending data
If you don’t get the water composition right, there are a number of things that can go wrong. Such as:
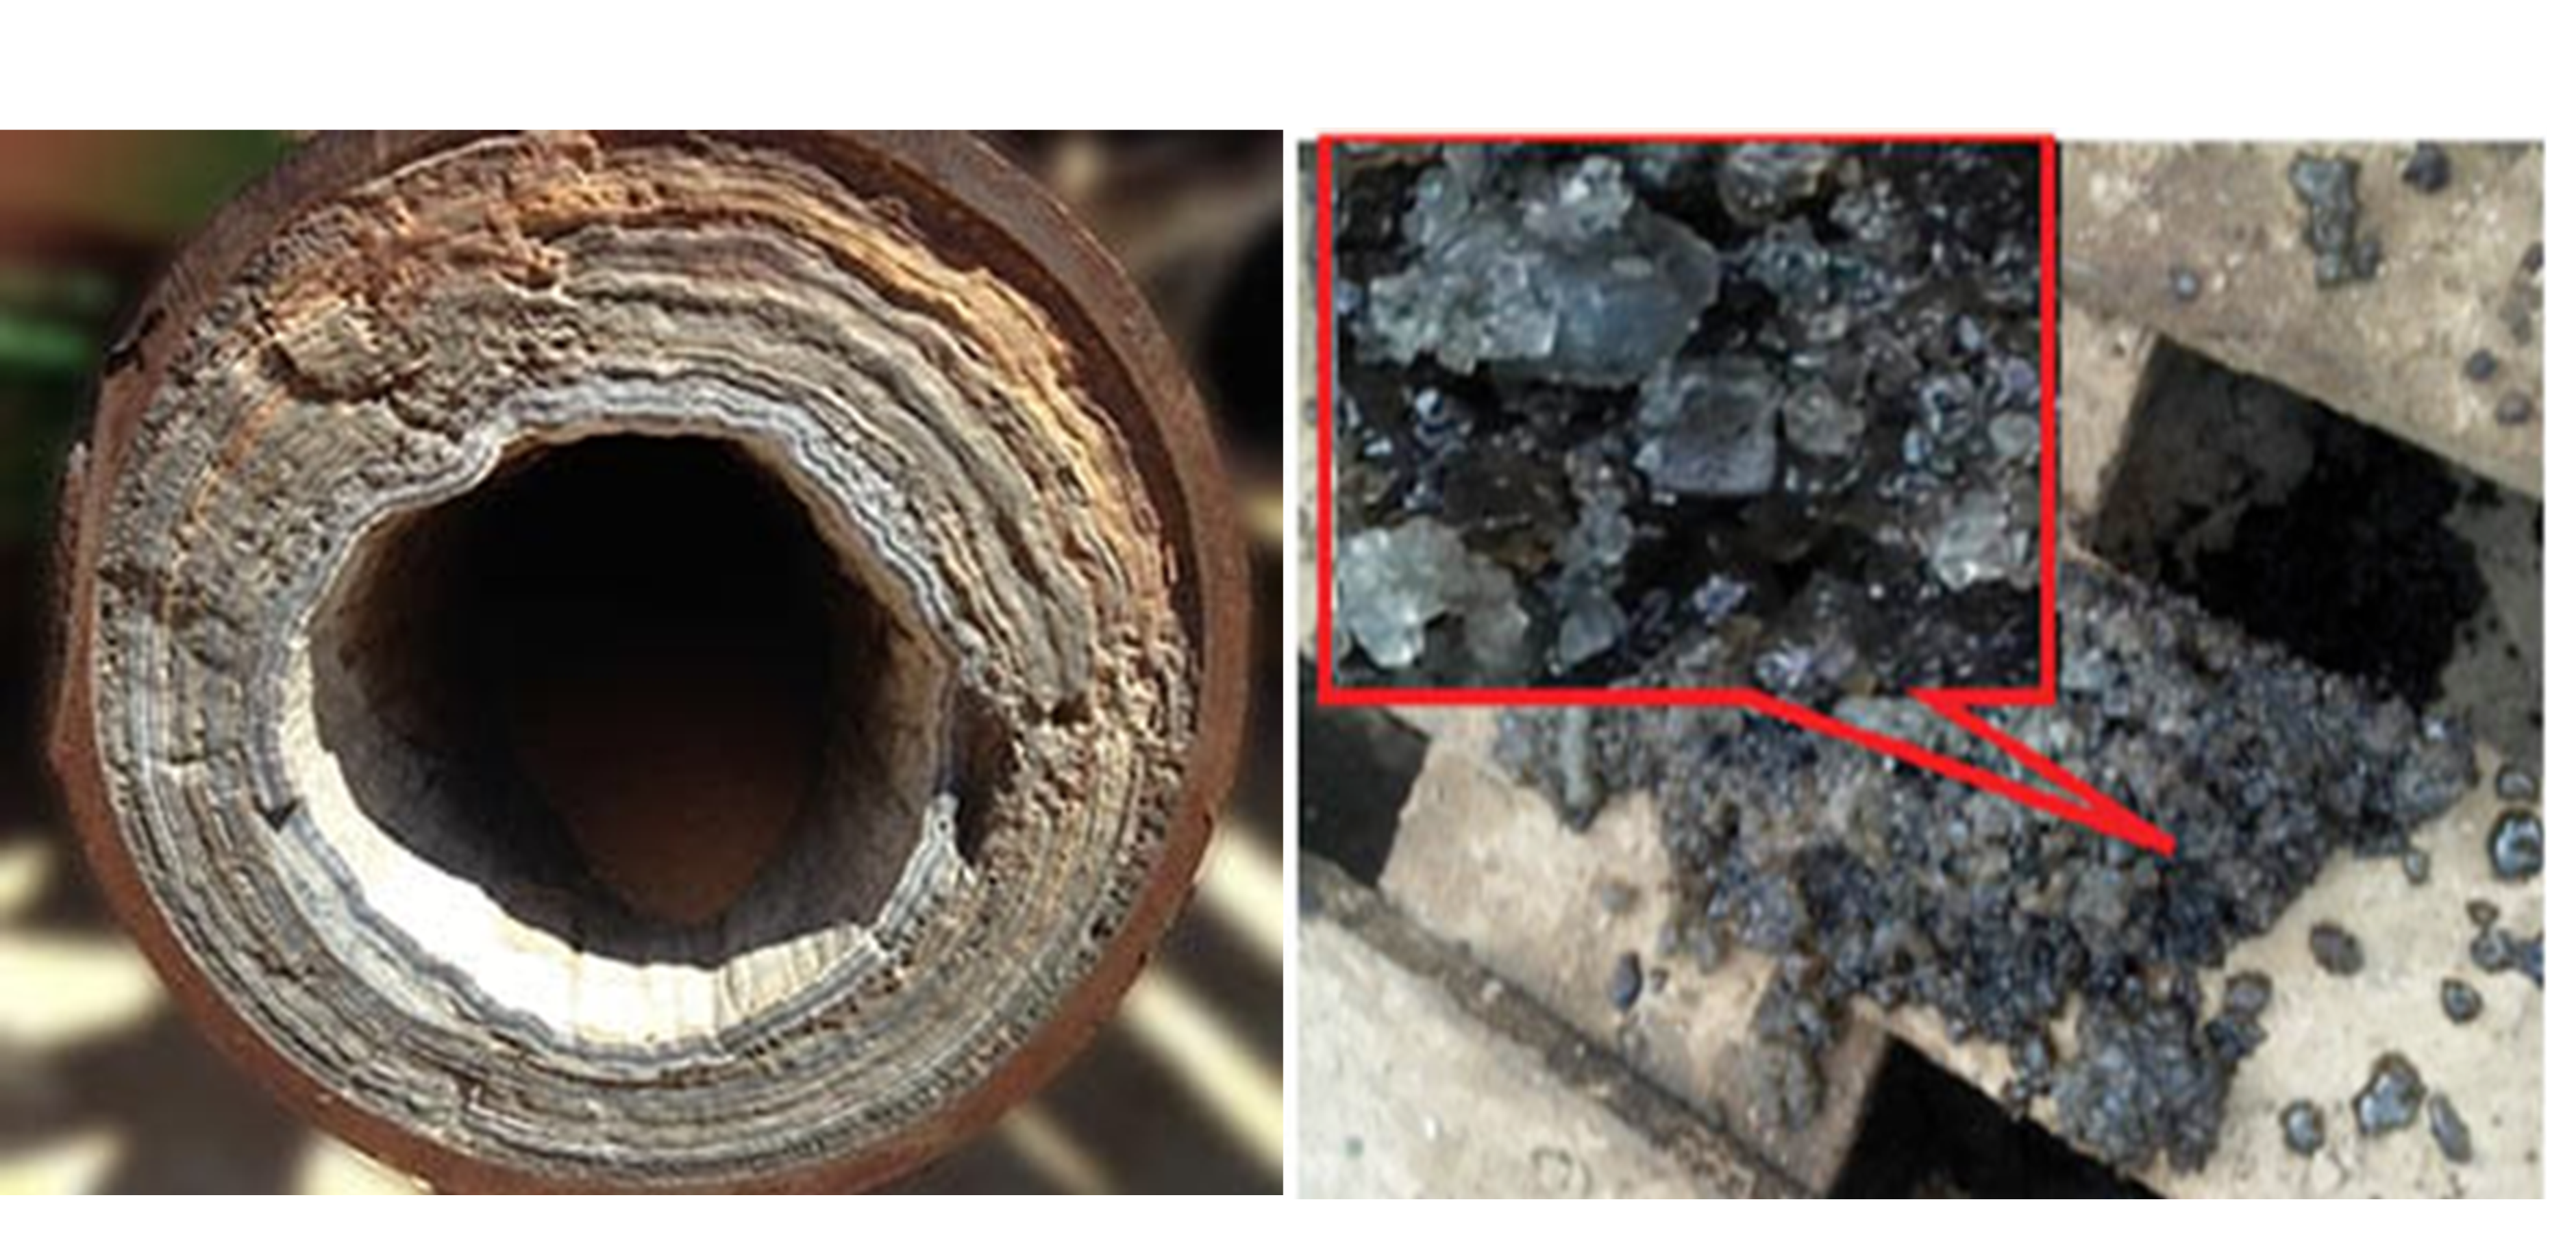
Inorganic scaling (mainly associated with CaCO3, BaSO4 and Halite scale formation)
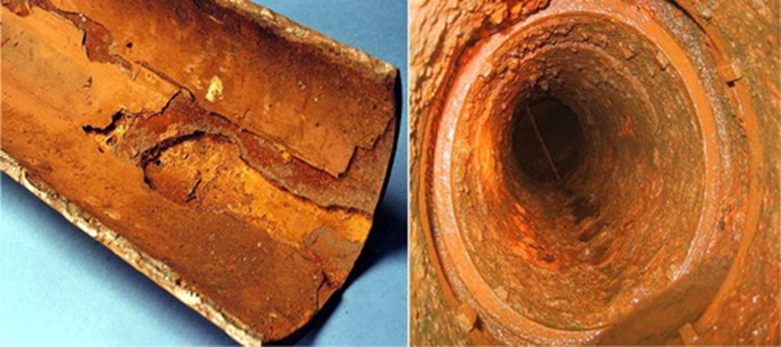
Corrosion
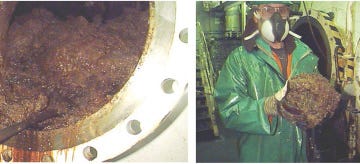
Calcium Naphthenates and Carboxylate Soaps
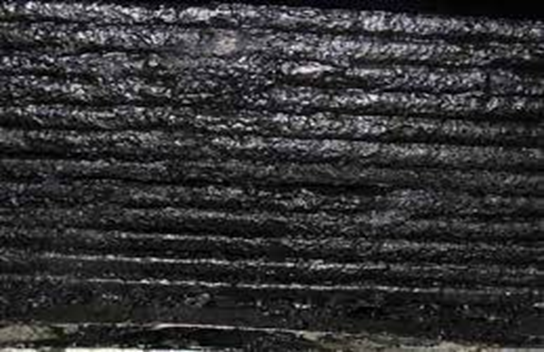
MEG reclamation unit fouling
Emulsions
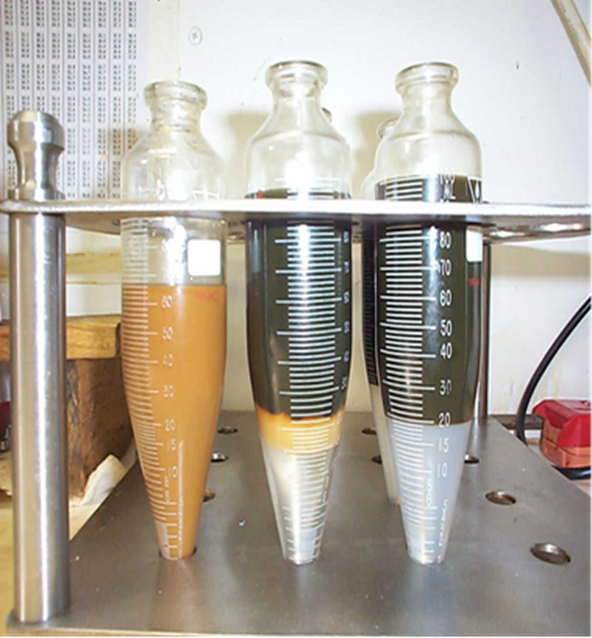
Obtaining Clean water samples
Hopefully it is now clear why using the right formation water composition for design and operational purposes is important. Therefore, the next step is to know how to take a downhole water sample with the least amount of drilling fluid contamination in the shortest period of time possible.
This is important as the drilling fluid, especially water-based drilling fluids are likely to have components which will contaminate any formation / aquifer water sample taken. Potential contaminants are NaCl, KCl, CaCl2, acetic acid, BaSO42-, etc. To minimize drilling fluid contamination there are downhole tools available that identify when the fluid sample to be taken has been cleaned up enough to minimize drilling fluid contamination. One example of this type of tool is the “Quicksilver probe” supplied by SLB. Other service companies have their own version of this type of tool. You just need to ask them about it.
These tools are not always 100% efficient so you can still get a small amount of contamination that needs to be taken into account. To understand how much the sample is contaminated one can ask for a chemical tracer to be added to the drilling fluid, with the aim for it to show up in the water sample. By measuring the chemical tracer, you can accurately determine the amount of drilling fluid contamination there is. If you know the level of contamination and the composition of the drilling fluid, you can then back calculate the contamination out of the analyzed water sample.
If you are to use a chemical tracer, it is important that the tracer has a chemical composition that would not naturally occur in the water sample being taken. One example of a tracer the author has used in the past is sodium thiocyanate (NaSCN).
Once you have gone through the effort of getting a nice clean water sample, the last thing you want to happen is for the sample’s integrity to be compromised during its journey to the laboratory for analysis. In many instances, the samples age and that process can potentially cause a change in composition even for pressurized samples in many instances. Taking that into account when a pressurized downhole water sample is taken it is recommended that this is blown down offshore and preserved for transport. In the case where you want to keep a water sample long term then it is probably better if you keep the sample pressurized.
For me if I have a choice I prefer to analyze the water sample as quickly after it has been taken and preserved. This way you minimize the chance of the sample aging and affecting the results.
With sample preservation being so important Pontem has developed a comprehensive water sample preservation process.
Water Sample Preservation Requirements
When taking water samples from any oil or gas well it is important that they are appropriately preserved offshore to maintain their integrity before they are analysed. This is because without sample preservation, changes in temperature and ageing of the sample may cause the composition of the water to change causing misleading results to be obtained.
To help with the above process we have provided some information on the recommended water preservation techniques to use
Water Preservation Techniques
1) WATER SAMPLE PRESERVATION FOR CATIONS (METALS) ANALYSIS
If possible, use an acid-washed glass bottle for this sample. This can be done on-site, by rinsing the bottle with deionised water with acid added.
Immediately after sampling, add 3 mL of 35% nitric acid (1 part conc. acid to 1 part water) to 1 litre of sample, or 2 ml to 500 mL, or 1 mL to 100 mL.
Check the pH if possible using indicator paper – it should be below pH 2. If not, add another 1 mL of acid.
2) UNPRESERVED WATER SAMPLE FOR OTHER ANALYSES (pH, ANIONS, etc)
Fill the bottle with sample (leave minimal air space). Keep cool (below original sample temperature, if possible). Submit for analysis without delay. A minimum volume of 100 ml is desirable.

To keep water samples cool I have used an Esky to great effect. They can be used for storing water samples as well as beer 😊(probably best not to do it at the same time though).
3) WATER SAMPLE PRESERVATION FOR VOLATILE FATTY ACIDS (VFA) ANALYSIS
Add 1 mL of 6N sodium hydroxide solution to XXX mL water sample (labelled 6N NaOH) – CAUTION: STRONGLY CAUSTIC, WILL BURN SKIN.
Cap the bottle tightly and invert it several times to mix the contents.
Check the pH if possible using indicator paper – it should be above pH 9. If not, add another 1 mL of NaOH and shake again.
Only a small volume of water (10 ml) is needed for VFA analysis. However, if the sample volume is less than 100 ml, write the actual volume of NaOH solution added on the label of the bottle. A correction can then be made to the result.
Once in the hands of the laboratory that is performing the water analysis. It is important to use the correct analytical methods to minimize any analytical errors in the final concentrations measured.
Now for the Science Bit
Once you have acquired the water samples, minimized contamination, preserved the water for transportation, and got them to the lab for analysis. The next thing we need to do is work out what analytical chemistry techniques to use. For Chemistry Nerds like me I would say this is the fun part.

Figure 1: Young Stephen Hamilton…not on Halloween.
Strap-in for an analytical chemistry lesson.
The analysis of the formation / aquifer water samples involves a number of sophisticated analytical techniques that are not available everywhere so it is important you know what is required so you can go and find a lab to do the analysis that is needed. The main companies that do this in the oil and gas industry in alphabetical order are:
1. Corelab
2. Expro
3. Intertek
4. SLB
However, you might not be able to always access this expertise so you may need to look closer to home. If that is the case, then in-country Universities and NOC / Oil and Gas Industry Research labs are good alternative options.
Here are the things that you would want to analyze for to get a workable formation water composition:
Cations (Metal Ions such as Na+, K+, Ca2+, Mg2+, Ba2+, Sr2+, etc)
Anions (eg. Cl-, SO42-, HCO3-)
Volatile Fatty Acids (e.g. formic acid, acetic acid, propanoic acid, butanoic acid, etc)
VFA’s are probably one of the most overlooked and under reported analytes in proper brine characterization. Without these values in hand, several risk analysis profiles are left with wider uncertainties, which can impact start-up costs and future OPEX.
pH – Ideally the pH should be performed onsite as soon as the water sample has been blown down as changes in dissolved CO2 and exposure to the atmosphere will change the pH over time.
Salinity / Conductivity
Density
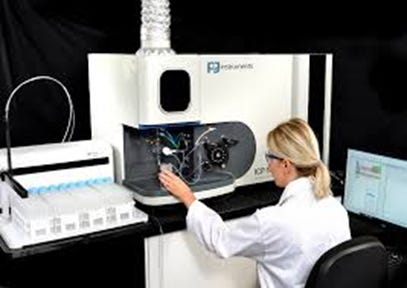
Cations Analysis Method
Metal ions such as Na+, K+, Ca2+, Mg2+, Ba2+, Sr2+, Fe2+ are analyzed with Inductively Coupled Plasma Atomic Emission Spectroscopy (ICP AES).
ICP AES is an analytical chemistry technique used to detect and quantify the concentrations of chemical elements in a wide variety of samples. The method is known for its high sensitivity, accuracy, and ability to analyze multiple elements simultaneously, from trace to major component levels.
How ICP-AES works
The ICP-AES process involves several key steps:
Sample preparation: The sample must first be converted into a liquid form. Solids are typically digested using a strong acid or fusion techniques, while liquids may be diluted or used directly.
Aerosol generation: The liquid sample is pumped into a nebulizer, which turns it into a fine mist or aerosol with the help of a flowing argon gas.
Introduction to plasma: The aerosol is carried into the core of an argon plasma, a superheated (6,000–10,000 K) ionized gas that serves as the excitation source.
Excitation: Inside the plasma, the heat evaporates the solvent, breaks molecular bonds, and excites the atoms and ions, raising their electrons to higher energy levels.
Emission: As the excited electrons relax and fall back to their ground state, they emit light at specific wavelengths characteristic of each element.
Separation and detection: The emitted light is directed into a spectrometer, which uses a diffraction grating to separate the light into its individual wavelengths. Detectors, such as charge-coupled devices (CCDs), then measure the intensity of the light at each specific wavelength.
Quantification: By comparing the intensity of the measured light to calibration standards with known concentrations, the instrument calculates the concentration of each element in the sample.
Key features and advantages of ICP AES
Multi-element analysis: Can measure up to 70 different elements in a single analysis run, which dramatically speeds up testing.
Wide dynamic range: Can accurately measure elemental concentrations from parts-per-billion (ppb) to high percentages within the same sample, reducing the need for multiple runs.
High sensitivity: Offers excellent detection limits, especially for metals and semimetals.
Minimal interferences: The high-temperature plasma minimizes the chemical interferences that affect other techniques like atomic absorption spectroscopy (AAS).
The use of ICP takes care of the metal cations and some of the other elements such as phosphorous (P), Sulfur (S), Arsenic (As), etc. Now we measure pH and conductivity of the water. This can be done using ASTM D1293 and ASTM D1125 respectively.
Anions Analysis Methods
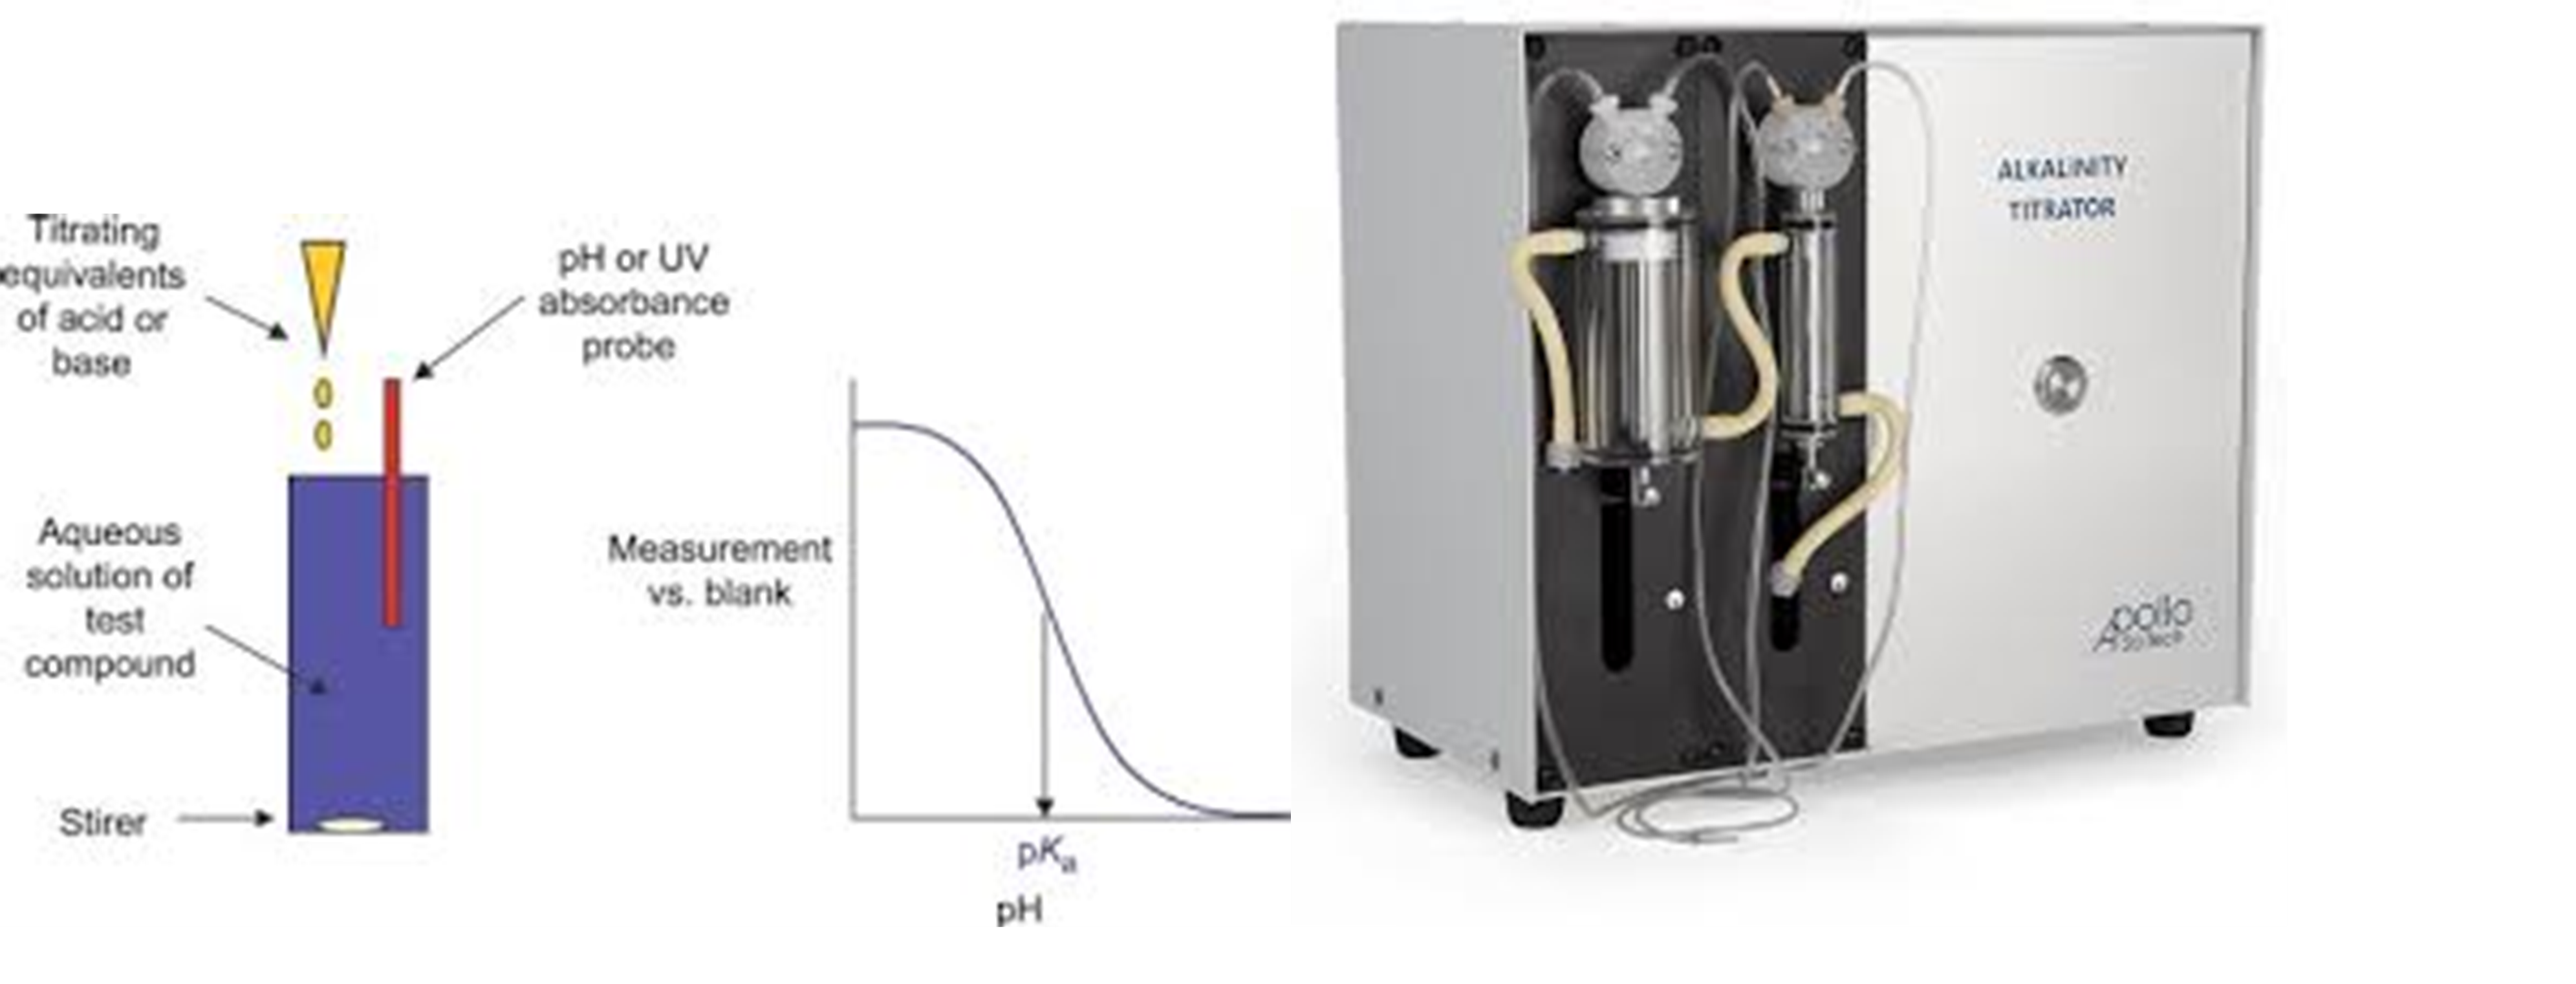
The next in line should be the analysis of the anions such as Cl-, SO42- and HCO3-. The first anion, we will discuss is HCO3-. This can be determined by measuring the total alkalinity of the water sample. This is measured using a potentiometric titration by titrating hydrochloric acid into the water sample until the equivalence point is reached.
Total alkalinity is usually reported as HCO3- concentration. However, you need to be aware that although most commonly reported as HCO3- , it is actually a mix of carbonate, carboxylate and hydroxide species.
Total alkalinity equation is
AT = [HCO3-]+[CO32-]+[Acetate]+[OH-]-[H+]
In most cases the vast majority of the alkalinity is associated with the HCO3-ion but where there are high levels of volatile fatty acids you may get excess HCO3- causing the formation water to be supersaturated in CaCO3 at reservoir conditions. If that happens you just need to remove enough HCO3- ions from the water so that at worst CaCO3 is at equilibrium saturation at reservoir temperature and pressure.
Although a tried and tested method, the use of a titrator does provide a greater spread of results than compared to the cation results you get from the ICP. There is an alternative method that is not so commonly used and that is the use of Ion Chromatography (IC) which can be used to differentiate between the various alkaline species thus providing some added confidence in the HCO3- results obtained. There are some advantages in knowing the “true” bicarbonate numbers, however the main point of emphasis is to understand what values the laboratory is reporting back so subsequent calculations and modeling will be appropriate and accurate. We have provided some additional information on the use of Ion Chromatography later in this post.
Therefore, it is important to look more carefully at the results and not just assume the number generated by the lab is the correct value. Where possible it is good to get a result from a second analysis technique or lab.
Finally, one little tip I think is worth sharing regarding the HCO3- concentration is that if your analysis gives you > 2,000 mg/l of HCO3- then there is something probably wrong.
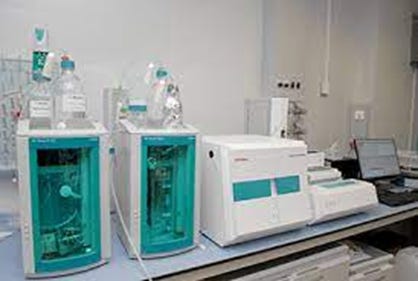
For the other anions (Cl-and SO42-) that are needing analyzed; it is recommended to use ASTM D4327 or better which uses Ion Chromatography (IC also known as Dionex). Ion chromatography can also be used to analyse for Volatile Fatty Acids but first they must be converted to their carboxylate salts to make sure they do not flash off from the water sample during the sample transportation process. (See Water preservation procedure)
Ion Chromatography (IC) separates ionic substances by exploiting their different charge properties. A sample is introduced into a column containing a stationary phase with fixed charged groups. Ions in the sample then compete with the stationary phase’s counterions for binding sites, retaining them based on the strength of their ionic interactions. A mobile phase (eluent) then washes the ions through the column, with different ions eluting at different times, allowing for their separation and identification.
Here’s a breakdown of the key principles:
Charged Stationary Phase: The column is packed with a material that has immobilized charged groups.
Anion Exchange: The stationary phase contains positively charged groups to attract negatively charged ions (anions).
Cation Exchange: The stationary phase contains negatively charged groups to attract positively charged ions (cations).Sample Introduction: The sample, containing the ions to be separated, is injected into the column.
Ion Exchange: Ions in the sample compete with exchangeable counterions for binding sites on the stationary phase.
Ions with stronger coulombic (ionic) interactions with the stationary phase will bind more tightly.
Factors such as charge density and ion size influence the strength of these interactions.Elution: A mobile phase (eluent), which is a solution of ions, is passed through the column.
The eluent displaces the ions bound to the stationary phase, causing them to separate. Ions that bind weakly are washed away first, while more strongly bound ions require altered conditions (e.g., higher ionic strength) to elute.Detection: As the separated ions exit the column, they are detected, most commonly by conductivity, which measures how well the solution conducts electricity.
If an Ion Chromatogram is not available, the following methods to analyse for SO42- and Cl- can be used:
SO42- - APHA 4500-SO4 E (colorimetric) or another option is to use ICP-AES to measure total sulfur content in the formation water and then assume that all the sulfur is associated with SO42-. This is not ideal as you can overestimate the level of SO42- ions present if there are other forms of sulfur ions present such as sulfides.
Cl- - APHA 4500-Cl B (titration). Although a commonly used method, it is probably less accurate than ion chromatography.
Evaluation of the Results
All of the above analytical methods are effective at analyzing the various components in a formation water sample. However, it is the authors opinion that ICP-AES is the most reliable method for measuring the various cations and elemental species in the water and that Ion Chromatography is the most reliable method for analyzing the anions compared to the various titration techniques.
It is also worth noting that the quality of the results can vary from lab to lab so it is important to have a reasonable amount of skepticism when reviewing the results of any analysis that has been performed. When it comes down to it you can send exactly the same water sample to three different labs, and you will probably get three different answers. Trying to fathom what is right in those instances really comes down to experience and understanding what “good” should look like.
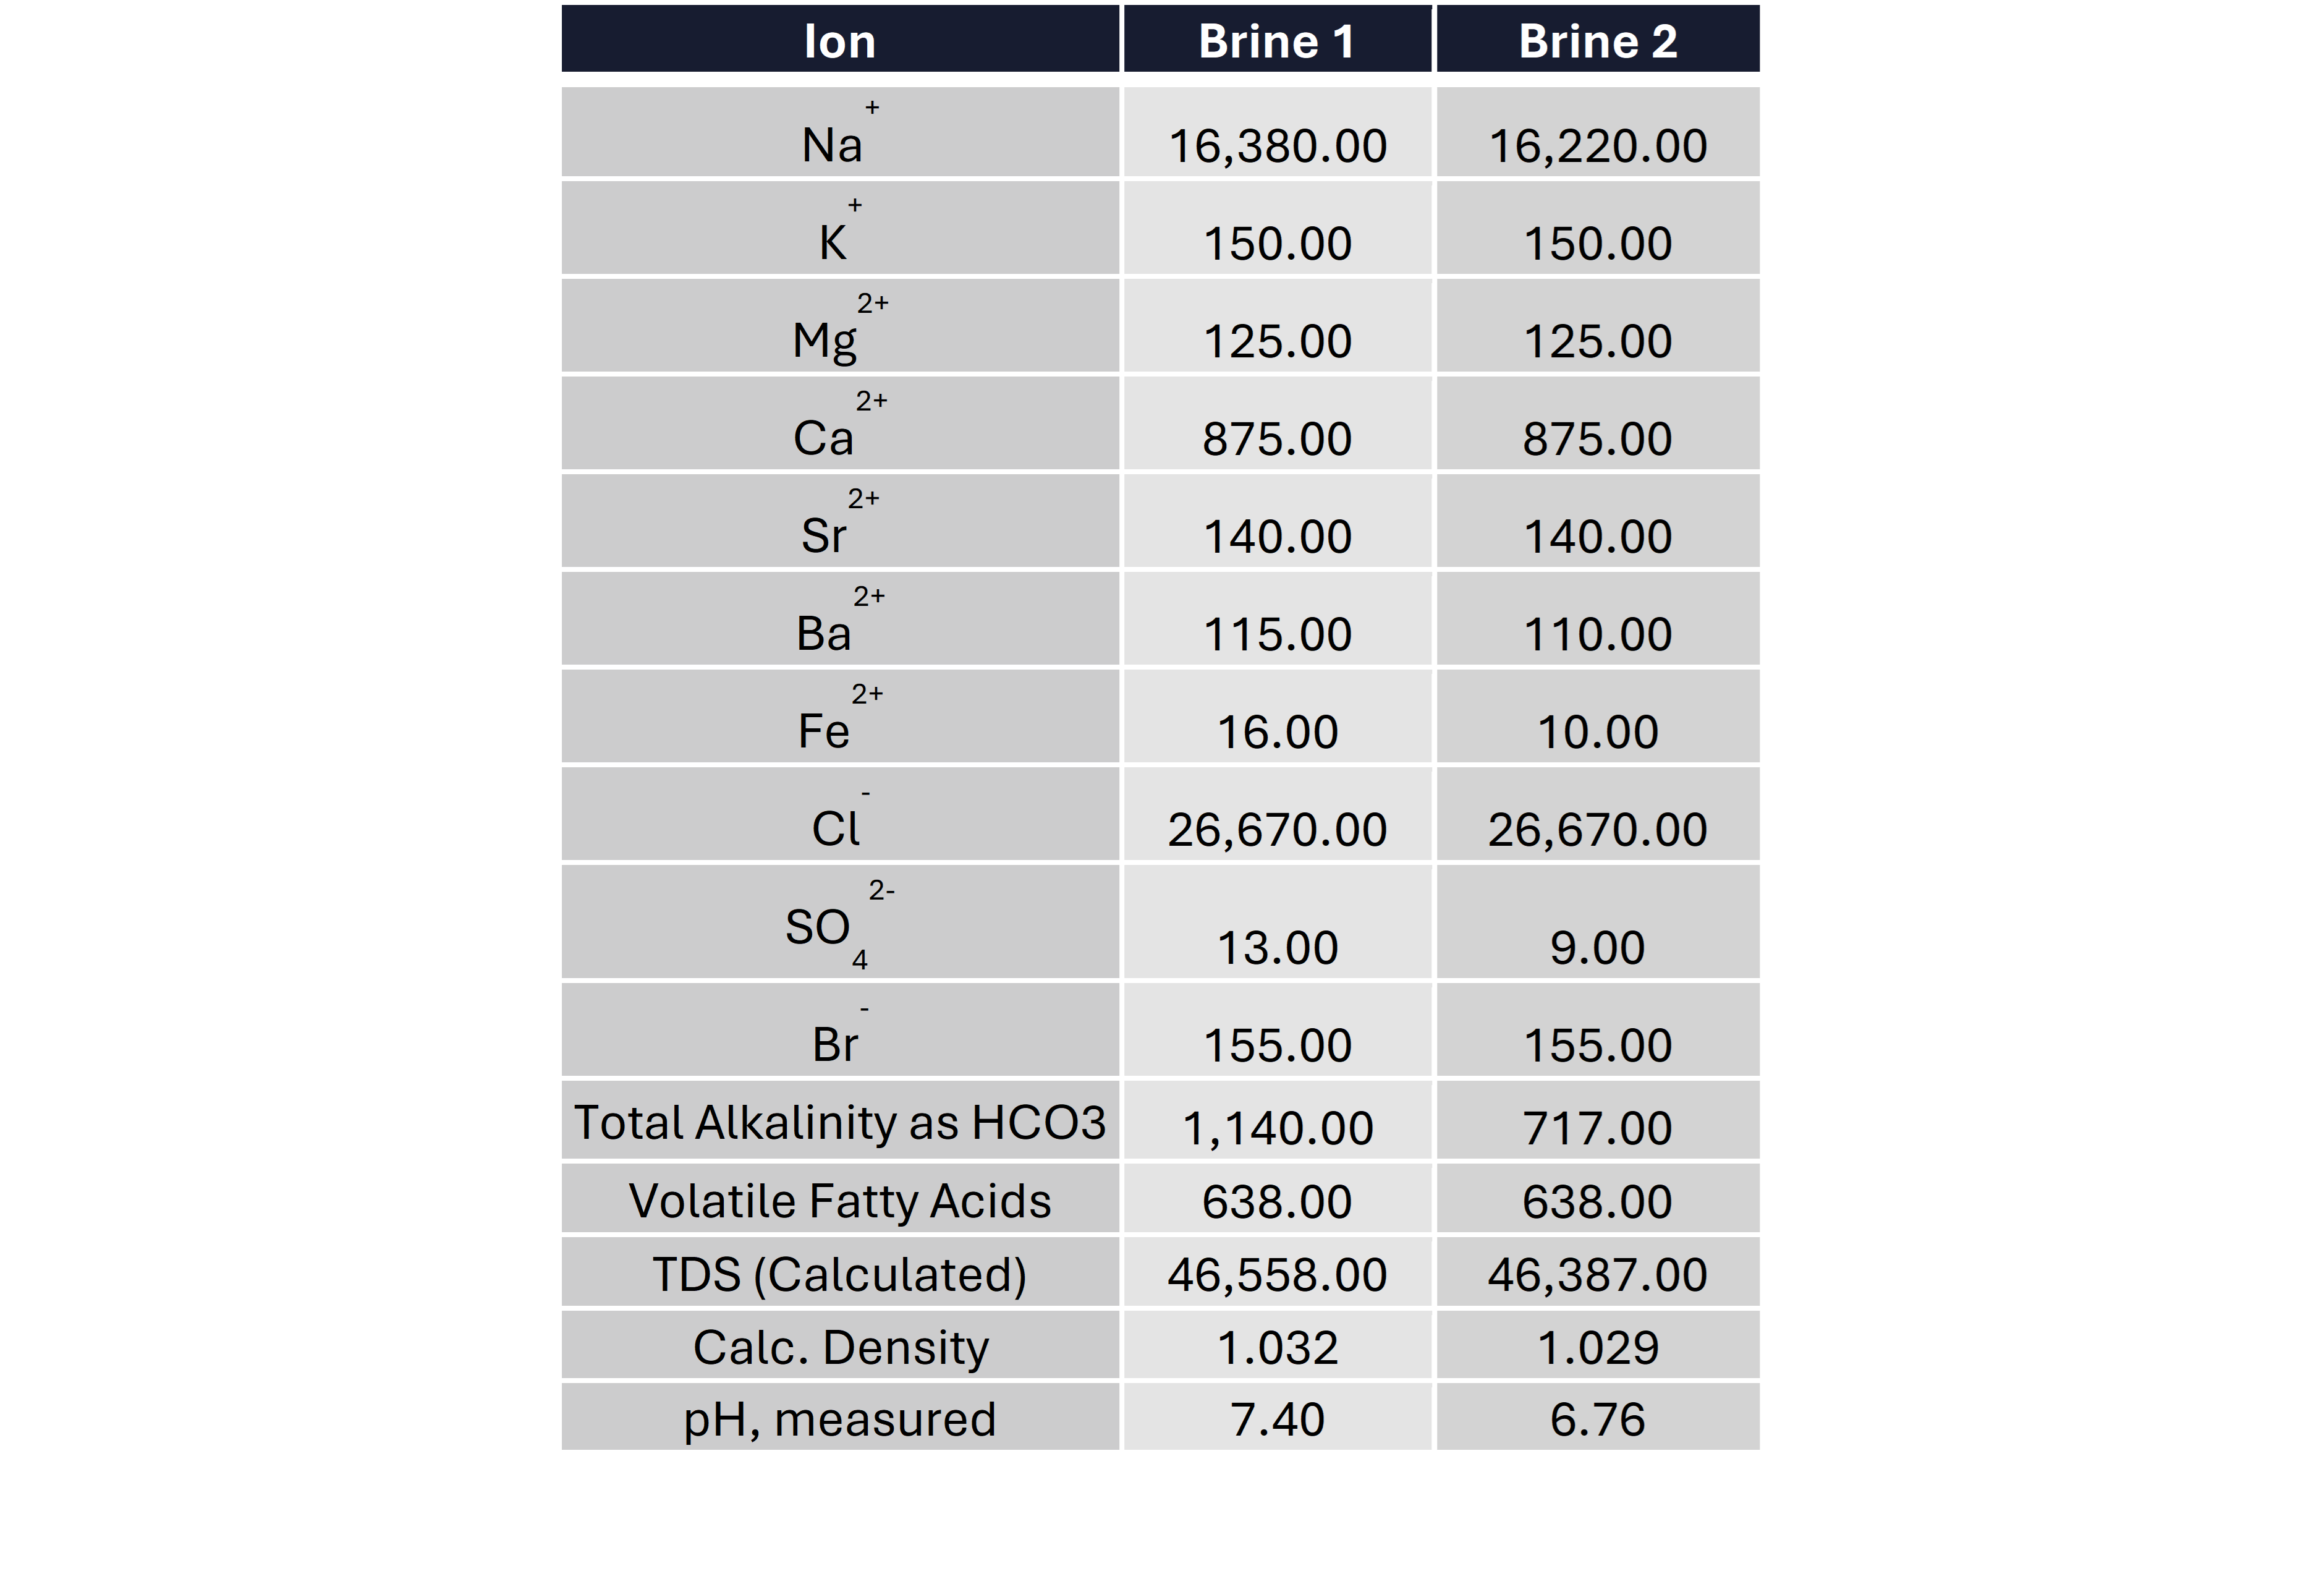
Once all the analysis is done you usually get a results table that looks a bit like this. This table has the minimum data you need to allow you to do the analysis such as determining the scaling and corrosion risks associated with the water. In many instances you can get a lot more cations and anions analyzed depending on your requirements. If you are worried about heavy metals such as lead, cesium, vanadium, etc. They can be analyzed but you may have to tell the lab that you would like those included as they don’t always get automatically measured / reported.
Quick QA/QC checks
Once you see the water analysis results from the lab there are a few things you can do to check if the results look “right”. These are:
Check what type of geology the water has come from. For example if it is a lacustrine environment, the water salinity may be very low (TDS < 5,000 mg/l) or if it is near a “salt dome” the formation water may be virtually saturated in NaCl (TDS >250,000 mg/l).
Are the K+ and/or Ca2+ concentrations in the water similar or higher than the Na+ concentration? If they are, check what brine was used in the drilling fluid. There is a good chance the sample has been contaminated.
Unusually high levels of VFA usually may mean some contamination from acetic acid contained in the drilling fluid or well clean-up fluids but worth checking whether other fields in the same area have high levels of VFA because there are formation waters that do have high levels of VFA but they aren’t very common. I talk a little bit more about this later in this post.
Does the water sample have a high concentration of Fe2+ (>20 mg/l)? If it does it may be caused by corrosion of the sample bottle or well tubing. Also worth checking if the rock, the water has come from contains high levels of iron ore just in case the Fe2+ values are correct.
Finally, as well as the above, one of the best things you can do is to make sure that the water composition makes sense from a geological perspective. This involves determining whether there is any scaling components either supersaturated or undersaturated in the formation water that in reality should be saturated in the water at worst. You do this because at reservoir temperatures and pressures experienced, water that has been sitting in the rock for millions of years at pretty much the same conditions should not be supersaturated. That is because any inorganic scale that could have dropped out would have dropped out and left whatever dissolved salt that was left as saturated in the formation water. Also, for CaCO3 the expectation is that in the CO2 rich environments we have in the oilfield, the default is to expect any formation water to be saturated in CaCO3 at reservoir conditions. Sometimes this can be a fairly straight forward process, or it can take some time to get right but it is certainly worth doing. If you want to learn more about this process Pontem have already written an excellent Substack post looking at this exact process.
That's What I Call High Quality H2O...

In oilfield production, fluid analyses are important measurements in many phases of development and operations. Compositional analyses provide valuable insights on:
This process gets easier the more experienced you get because after seeing hundreds, if not thousands of different formation / aquifer water compositions you get to understand what “good” looks like. But it is still not easy as you have such a wide variation of water compositions. These can range from virtually mineral water samples with Total Dissolved Solids (TDS) no more than 1,000 – 2,000 mg/l to formation waters that are nearly saturated in NaCl with TDS contents of up to 300,000 mg/l.
In fact, one case I looked at last year was for a formation water that had >1,000 mg/l of acetic acid in its composition. Even though I had worked on fields that had these levels of acetic acid previously I still thought the acetic acid concentration was so high that there must have been some drilling fluid contamination as the drilling / clean-up fluid did contain acetic acid.
However, I knew I had to get this right because at these levels of acetic acid this could have a significant impact on the inorganic scaling (in a good way) and corrosion risks (in a bad way) associated with producing the formation water under evaluation.
Consequently, I did some more homework and fortunately for me I had formation water compositions for two nearby fields to compare against. Both fields had formation water compositions that had levels of acetic acid that were also > 1,000 mg/l. When you see that you know it isn’t drilling fluid contamination but a real effect as it is just not plausible that all three fields could have the same level of drilling fluid contamination when taking their water samples over a time period of multiple years.
Finally, once you are confident in the water composition you can start to use it to determine whether inorganic scale will deposit in the system. The level of the scaling ions like Ba2+, Ca2+, SO42- and HCO3- are critical components from the water analysis, and with respect to CaCO3 scaling, the pH is very important so you need to look at the HCO3- and VFA concentrations along with the CO2 content at the various pressures and temperatures in the system.
When assessing the corrosion risks the most important parameters taken from the water sample are; Chlorides, VFA concentration, pH and CO2. It is also worth noting that it is not the end of the world if you don’t have a reliable pH measurement because as long as you have the CO2 mol% in the gas phase and the system temperatures and pressures there are plenty software packages that can work out what the system pH is.
Usually for scaling, the more CO2 and less HCO3- in the system, the better it is for CaCO3 scaling as the pH is more acidic. For corrosion, the opposite is true, as low pH drives higher corrosion.
When it comes to evaluating whether a system has a calcium naphthenate or carboxylate soap problem. Here are a couple of helpful rules of thumb that can be invaluable when assessing a new field’s formation brine for Calcium Naphthenate and Carboxylate soap risks. A few include:
Calcium Naphthenates and Carboxylate Soaps can become an issue if the pH is greater than 6. Solids and soaps will begin to form in these higher pH scenarios.
Water compositions with high HCO3- and VFA concentrations (>1,000 mg/l, each for example) are indicative of oil with ARN acids that form the Calcium Naphthenates and Carboxylate Soaps. This combination of high levels of HCO3- and VFA frequently occurs when you have problems with Calcium Naphthenates and Carboxylate Soaps. It is not infallible but shouldn’t be ignored.
Hopefully this shows how much goes into obtaining a representative water samples and what sort of information you can get from it once it has been analyzed properly. If you want help from Pontem Analytics feel free to contact us.